
For the first time astronomers have combined data from NASA’s Chandra X-ray Observatory and James Webb Space Telescope to study the well-known supernova remnant Cassiopeia A (Cas A). As described in our latest press release, this work has helped explain an unusual structure in the debris from the destroyed star called the “Green Monster”, first discovered in Webb data in April 2023. The research has also uncovered new details about the explosion that created Cas A about 340 years ago, from Earth’s perspective.
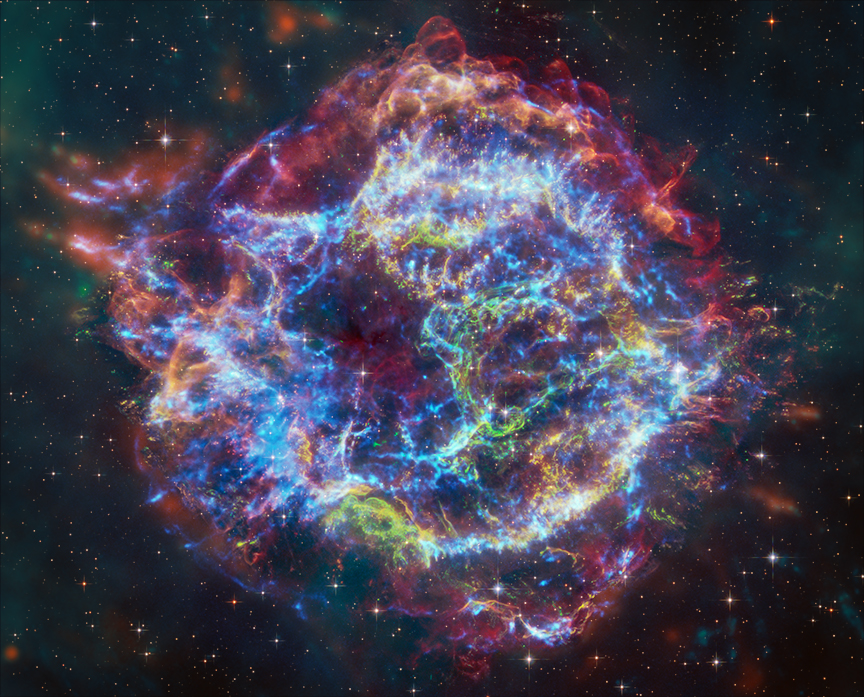
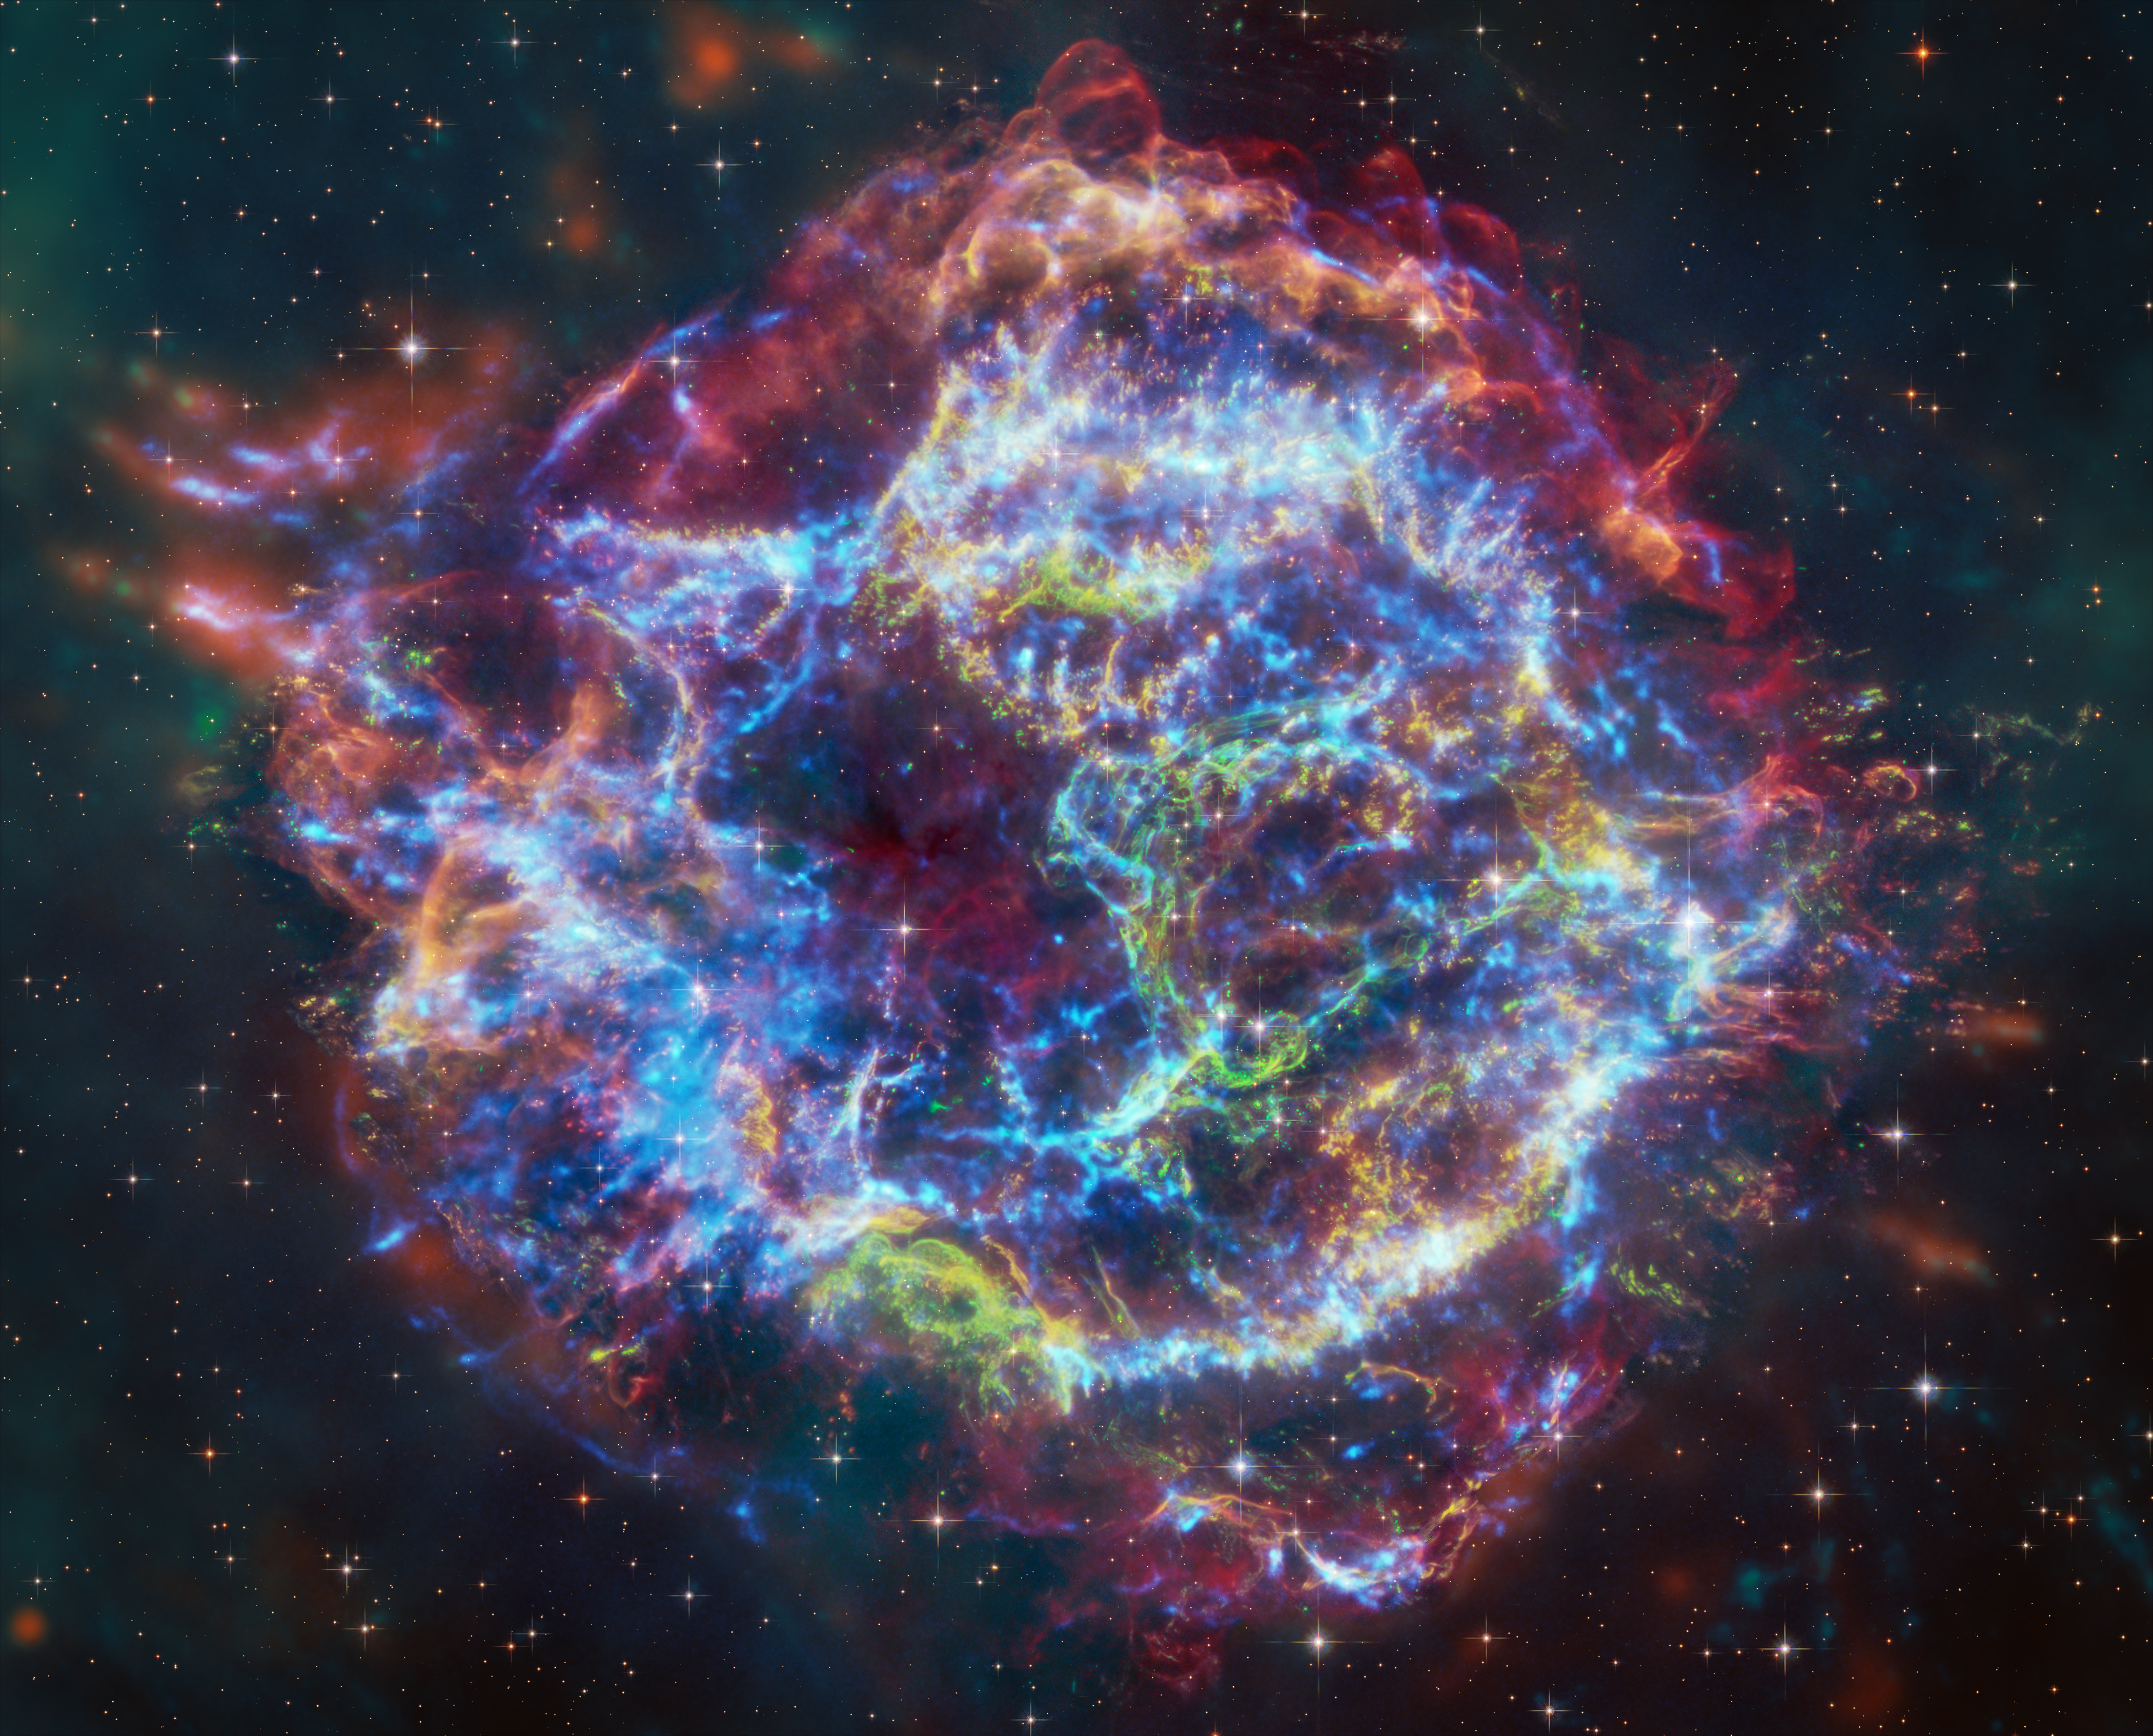
A new composite image contains X-rays from Chandra (blue), infrared data from Webb (red, green, blue), and optical data from Hubble (red and white). The outer parts of the image also include infrared data from NASA’s Spitzer Space Telescope (red, green and blue). The outline of the Green Monster can be seen by mousing over the image.
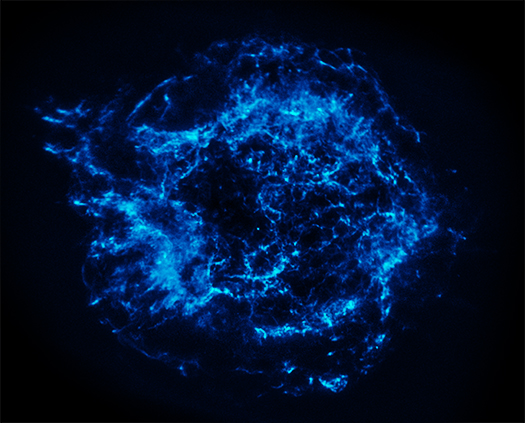
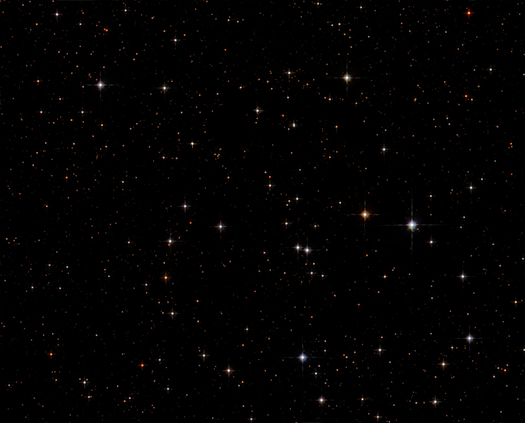
The Chandra data reveals hot gas, mostly from supernova debris from the destroyed star, including elements like silicon and iron. In the outer parts of Cas A the expanding blast wave is striking surrounding gas that was ejected by the star before the explosion. The X-rays are produced by energetic electrons spiraling around magnetic field lines in the blast wave. These electrons light up as thin arcs in the outer regions of Cas A, and in parts of the interior. Webb highlights infrared emission from dust that is warmed up because it is embedded in the hot gas seen by Chandra, and from much cooler supernova debris. The Hubble data shows stars in the field.
A separate graphic shows a color Chandra image, where red shows iron and magnesium at low X-ray energies, green shows silicon at intermediate X-ray energies and blue shows the highest energy X-rays, from electrons spiraling around magnetic field lines. An outline of the Green Monster, plus the locations of the blast wave, and of debris rich in silicon and iron are labeled.
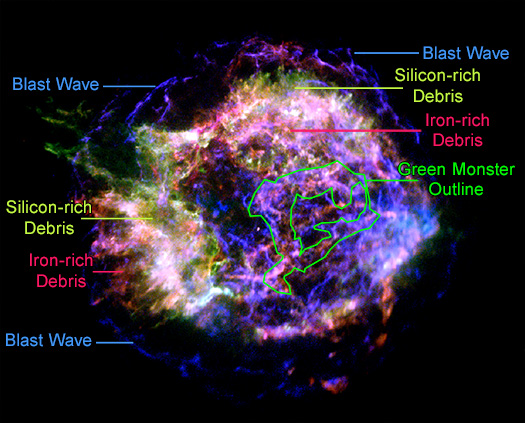
Detailed analysis by the researchers found that filaments in the outer part of Cas A, from the blast wave, closely matched the X-ray properties of the Green Monster, including less iron and silicon than in the supernova debris. This interpretation is apparent from the color Chandra image, which shows that the colors inside the Green Monster’s outline best match with the colors of the blast wave rather than the debris with iron and silicon. The authors conclude that the Green Monster was created by a blast wave from the exploded star slamming into material surrounding it, supporting earlier suggestions from the Webb data alone.
The debris from the explosion is seen by Chandra because it is heated to tens of millions of degrees by shock waves, akin to sonic booms from a supersonic plane. Webb can see some material that has not been affected by shock waves, what can be called “pristine” debris.
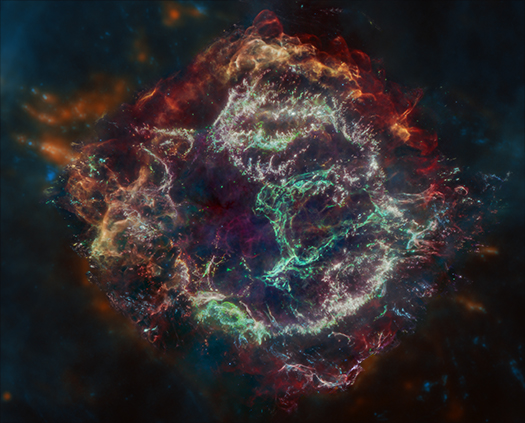
To learn more about the supernova explosion, the team compared the Webb view of the pristine debris with X-ray maps of radioactive elements that were created in the supernova. They used NASA’s Nuclear Spectroscopic Telescope Array (NuSTAR) data to map radioactive titanium — still visible today — and Chandra to map where radioactive nickel was by measuring the locations of iron. Radioactive nickel decays to form iron. An additional image shows the iron-rich debris (tracing where radioactive nickel was located) in green, the radioactive titanium in blue and the pristine debris seen in orange and yellow.
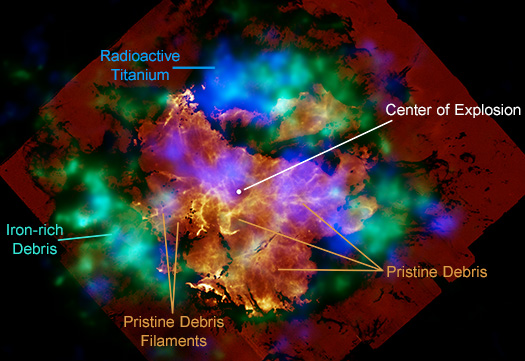
Some filaments of pristine debris near the center of Cas A, seen with Webb, are connected to the iron seen with Chandra farther out. Radioactive titanium is seen where pristine debris is relatively weak.
These comparisons suggest that radioactive material seen in X-rays has helped shape the pristine debris near the center of the remnant seen with Webb, forming cavities. The fine structures in the pristine debris were most likely formed when the star’s inner layers were violently mixed with hot, radioactive matter produced during collapse of the star’s core under gravity.
These results were presented by Dan Milisavljevic from Purdue University at the 243rd meeting of the American Astronomical Society in New Orleans. They are described in more detail in two papers submitted to Astrophysical Journal Letters, one led by Milisavljevic focused on the Webb results (preprint here) and the other led by Jacco Vink of the University of Amsterdam focused on the Chandra results (preprint here). The co-authors of Vink’s paper are Manan Agarwal (University of Amsterdam, the Netherlands), Patrick Slane (Center for Astrophysics | Harvard & Smithsonian - CfA), Ilse De Looze (Ghent University, Belgium), Dan Milisavljevic, Daniel Patnaude (CfA), Paul Plucinsky (CfA), and Tea Temin (Princeton University). Related papers by other members of the research team are also in preparation.
The Smithsonian Astrophysical Observatory's Chandra X-ray Center controls science operations from Cambridge, Massachusetts, and flight operations from Burlington, Massachusetts.
The James Webb Space Telescope is the world's premier space science observatory. Webb is solving mysteries in our solar system, looking beyond to distant worlds around other stars, and probing the mysterious structures and origins of our universe and our place in it. Webb is an international program led by NASA with its partners, ESA (European Space Agency) and the Canadian Space Agency.
A Small Explorer mission led by Caltech and managed by JPL for NASA’s Science Mission Directorate in Washington, NuSTAR was developed in partnership with the Danish Technical University and the Italian Space Agency (ASI). The spacecraft was built by Orbital Sciences Corp. in Dulles, Virginia. NuSTAR’s mission operations center is at the University of California, Berkeley, and the official data archive is at NASA’s High Energy Astrophysics Science Archive Research Center at the agency’s Goddard Space Flight Center in Greenbelt, Maryland. ASI provides the mission’s ground station and a mirror data archive. Caltech manages JPL for NASA.
This image of Cassiopeia A resembles a disk of electric light with red clouds, glowing white streaks, red and orange flames, and an area near the center of the remnant resembling a somewhat circular region of green lightning. X-rays from Chandra are blue and reveal hot gas, mostly from supernova debris from the destroyed star, and include elements like silicon and iron. X-rays are also present as thin arcs in the outer regions of the remnant.
Infrared data from Webb is red, green, and blue. Webb highlights infrared emission from dust that is warmed up because it is embedded in the hot gas seen by Chandra, and from much cooler supernova debris. Hubble data shows a multitude of stars that permeate the field of view.
|
||||||||||||||||||||||||||||||||


