
 Broadband
 Silicon
 Calcium
 Iron
Iron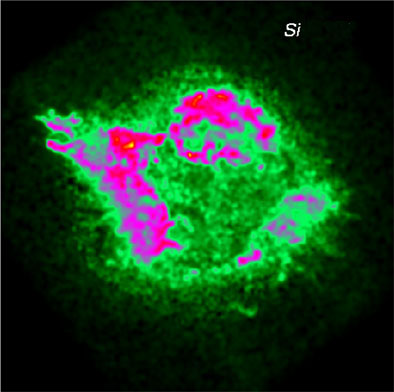
CXC Home | Search | Help | Image Use Policy | Latest Images | Privacy | Accessibility | Glossary | Q&A
Download Image
More Information
More Images
More Releases
Related Images
Cassiopeia A:
Elemental Image Of Exploded Star

Elemental Image Of Exploded Star
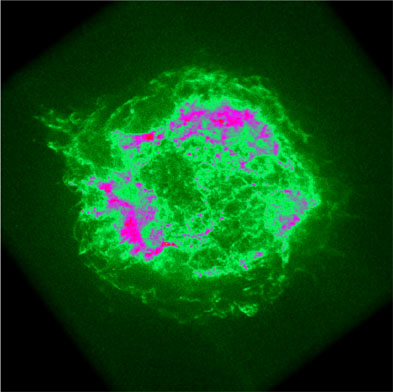
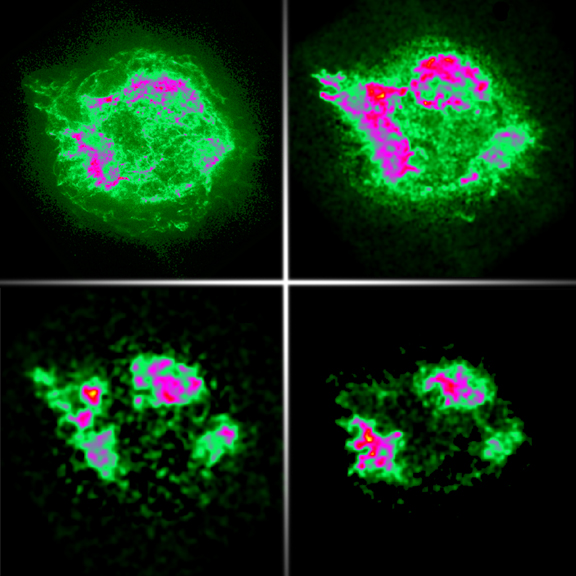
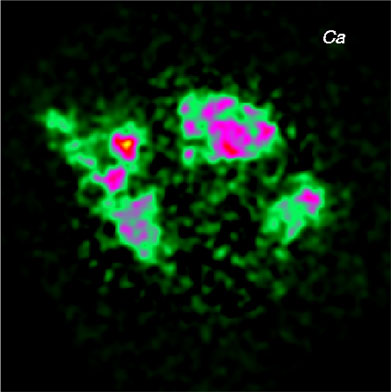
A new 14 hour Chandra observation of the supernova remnant Cassiopeia A has given the best map yet of heavy elements ejected in a supernova explosion. Upper left: Broadband X-ray image of Cassiopeia A (Cas A) Upper right: Image made by X rays from silicon ions. Lower left: Image made by X rays from calcium ions. Lower right: Image made by X rays from iron ions. All images are 8.5 arc minutes on a side (corresponding to 28.2 light years at a distance of 11,000 light years).
These images are designed to show the distribution of some of the elements ejected in the explosion that produced Cas A. The elements are part of a gas that has a temperature of about 50 million degrees Celsius. The colors represent intensity of X rays, with yellow the most intense, then red, purple, and green.
The broadband image, which shows all the X rays detected from Cas A, is more symmetric than the others. This could be due to the presence of X rays from synchrotron radiation by extremely high-energy particles spiraling in the magnetic field of the remnant, or to shock waves traveling through material puffed off thousands of years before the supernova.
The silicon image shows a bright, broad jet breaking out of the upper left side of the remnant, and faint streamers in an opposite direction. This jet could be due to an asymmetry in the explosion.
The calcium image is similar to the silicon image, but less bright and clumpier. The iron image shows significant differences from other images. Since iron is the heaviest element shown, these maps support the suggestion that the layers of the star were overturned either before or during the explosion.
|
||||||||||||||||||||||||||||
Visual Description:
The Chandra X-ray Observatory image of the supernova remnant Cassiopeia A consists of four panels, each depicting a different aspect of the remnant's appearance. The first panel shows a bright green and pink object in the center, surrounded by darker shades of blue and purple. The other 3 panels display various detailed views of the green and pink object, which appears to be an irregularly shaped nebula. The texture is characterized by numerous small bumps and depressions, with some areas appearing smoother than others. The intricate texture of the nebula can be likened to the surface of a cauliflower or a sponge, both of which have a distinctive, porous structure. These 14 hour Chandra observations of the supernova remnant Cassiopeia A provided a map of heavy elements ejected in a supernova explosion, broken down into four panels. Upper left: Broadband X-ray image of Cassiopeia A (Cas A). Upper right: Image made by X rays from silicon ions. Lower left: Image made by X rays from calcium ions. Lower right: Image made by X rays from iron ions. These images are designed to show the distribution of some of the elements ejected in the explosion that produced Cas A. The elements are part of a gas that has a temperature of about 50 million degrees Celsius. The colors represent intensity of X rays, with yellow the most intense, then red, purple, and green.
The broadband image, which shows all the X rays detected from Cas A, is more symmetric than the others. This could be due to the presence of X rays from synchrotron radiation by extremely high-energy particles spiraling in the magnetic field of the remnant, or to shock waves traveling through material puffed off thousands of years before the supernova. The silicon image shows a bright, broad jet breaking out of the upper left side of the remnant, and faint streamers in an opposite direction. This jet could be due to an asymmetry in the explosion. The calcium image is similar to the silicon image, but less bright and clumpier. The iron image shows significant differences from other images. Since iron is the heaviest element shown, these maps support the suggestion that the layers of the star were overturned either before or during the explosion.
Revised: September 10, 2025