Images by Date
Images by Category
Solar System
Stars
Exoplanets
White Dwarfs
Supernovas
Neutron Stars
Black Holes
Milky Way Galaxy
Normal Galaxies
Quasars
Galaxy Clusters
Cosmology/Deep Field
Miscellaneous
Images by Interest
Space Scoop for Kids
Multiwavelength
Sky Map
Constellations
Photo Blog
Top Rated Images
Image Handouts
Desktops
Fits Files
Visual descriptions
Image Tutorials
Photo Album Tutorial
False Color
Cosmic Distance
Look-Back Time
Scale & Distance
Angular Measurement
Images & Processing
AVM/Metadata
Image Use Policy
Web Shortcuts
Chandra Blog
RSS Feed
Image Use Policy
Questions & Answers
Glossary of Terms
Six Galaxy Clusters: Dark Matter is Darker Than Once Thought
MACS J0416.1-2403
MACS J0416.1-2403
Visual Description:

  • A study of 72 galaxy cluster collisions sets new limits on how dark matter interacts with itself.

  • Dark matter is the mysterious substance that makes up most of the matter in the Universe.

  • X-rays from Chandra and optical data from Hubble were used to help narrow down the possibilities of what dark matter can be.

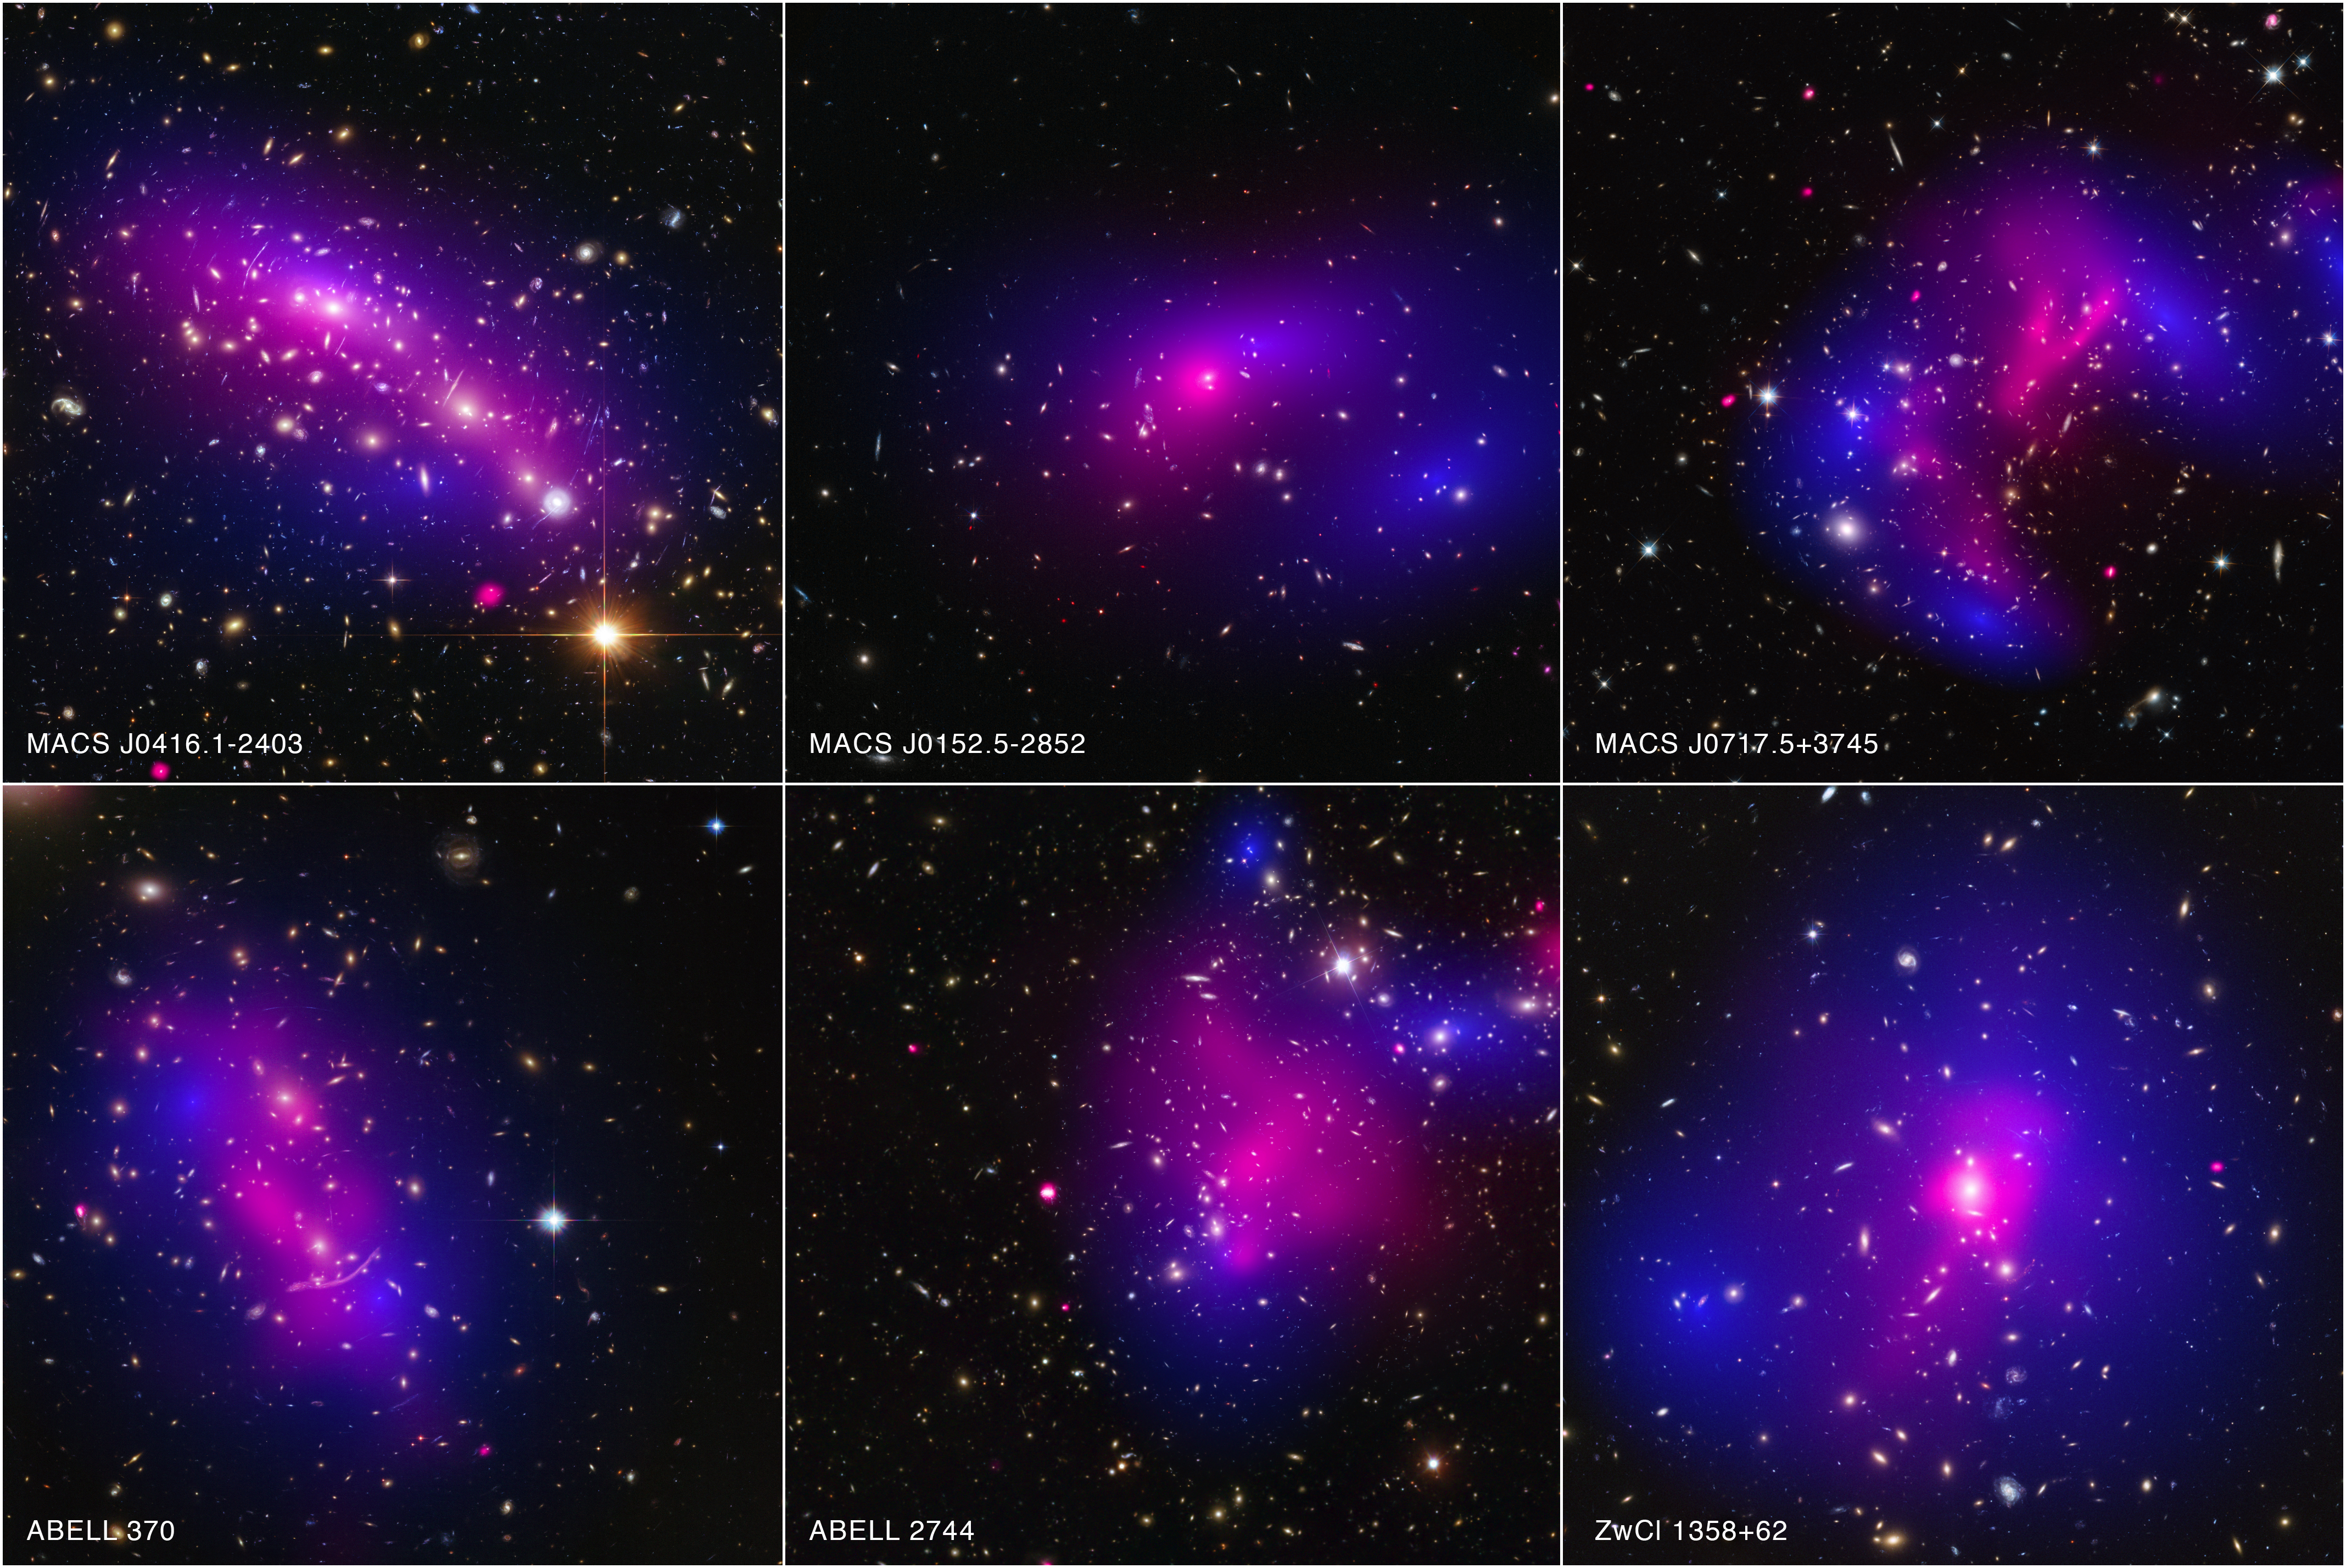
This panel of images represents a study of 72 colliding galaxy clusters conducted by a team of astronomers using NASA's Chandra X-ray Observatory and Hubble Space Telescope. The research sets new limits on how dark matter — the mysterious substance that makes up most of the matter in the Universe — interacts with itself, as reported in the press release. This information could help scientists narrow down the possibilities of what dark matter may be.

Galaxy clusters, the largest objects in the Universe held together by their own gravity, are made up of three main components: stars, clouds of hot gas, and dark matter. When galaxy clusters collide, the clouds of gas enveloping the galaxies crash into each other and slow down or stop. The stars are much less affected by the drag from the gas and, because they occupy much less space, they glide past each other like ships passing in the night.

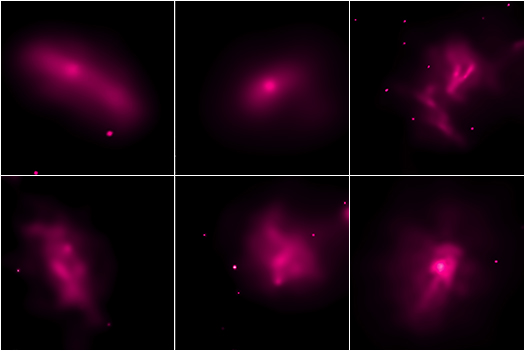
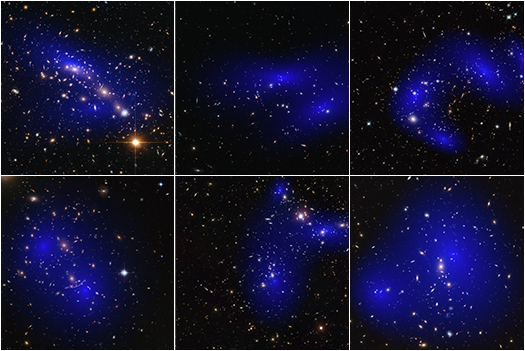
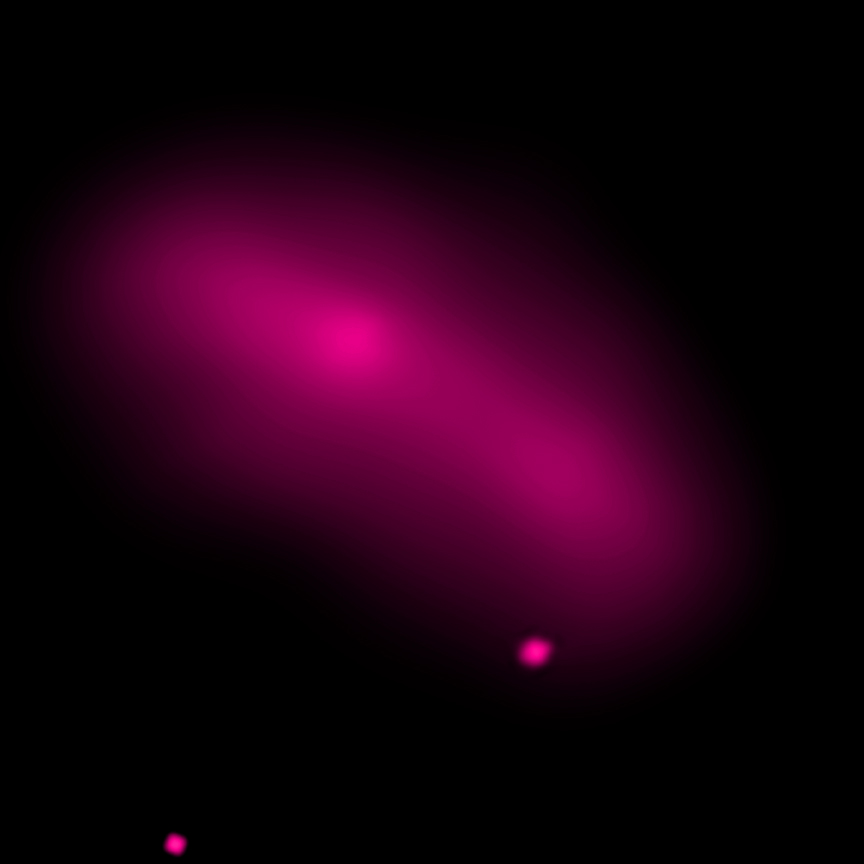
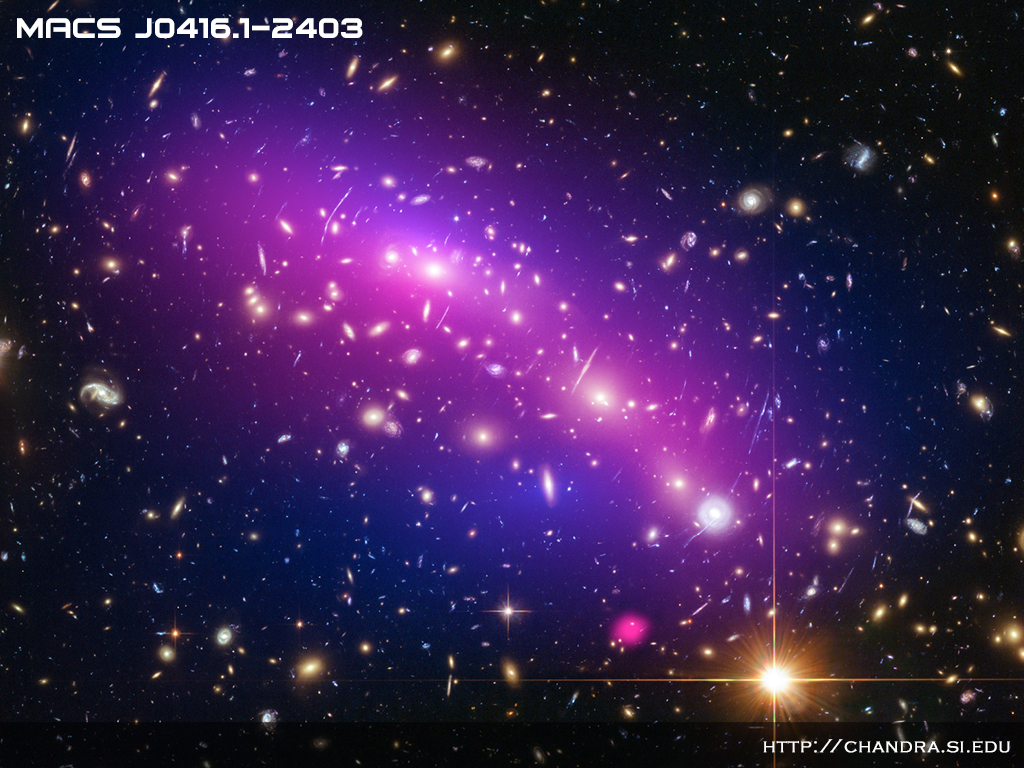
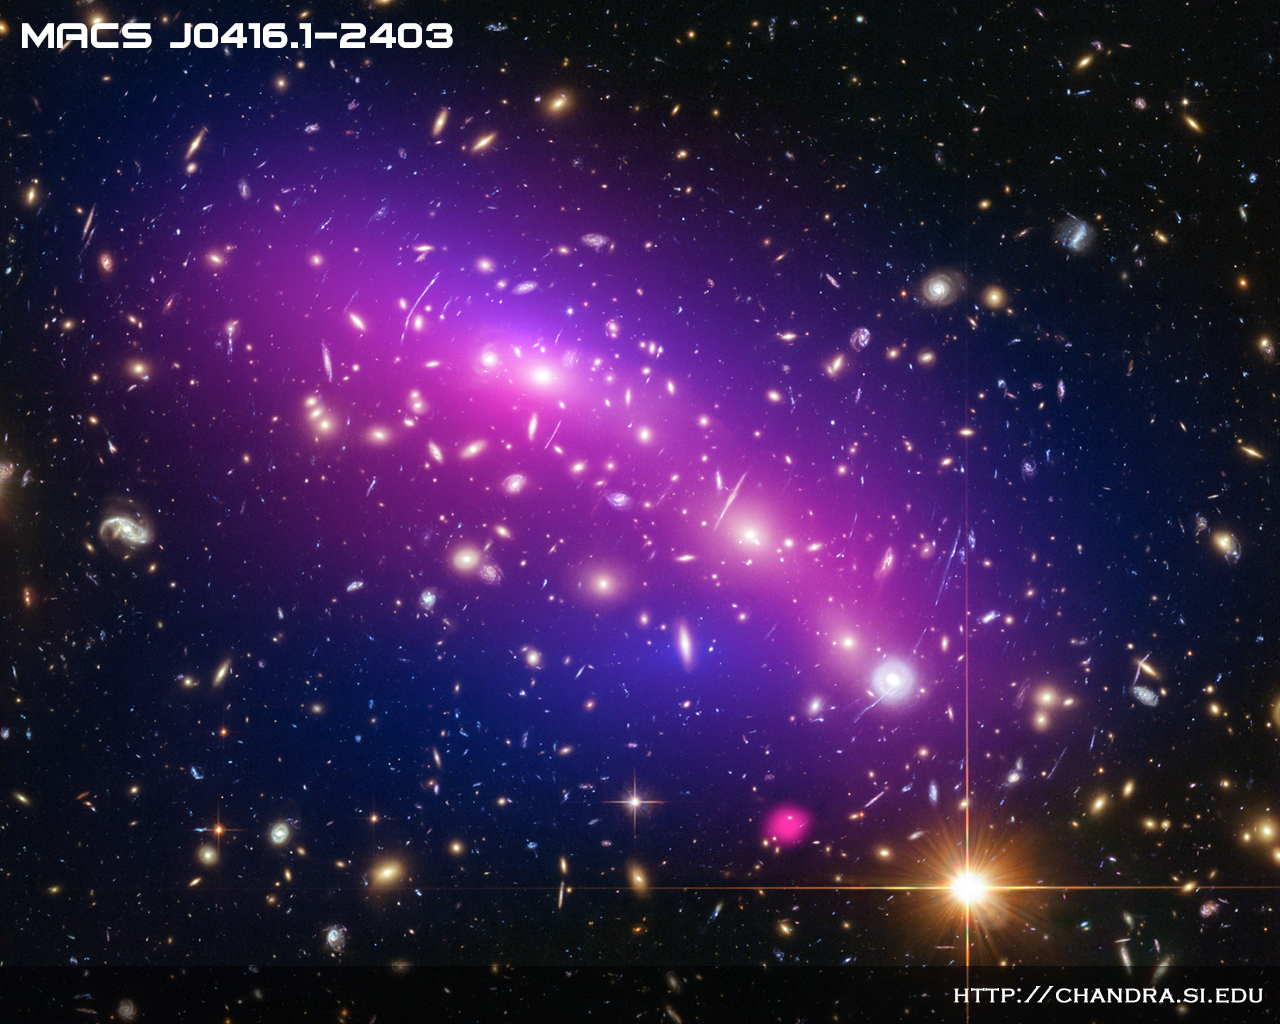
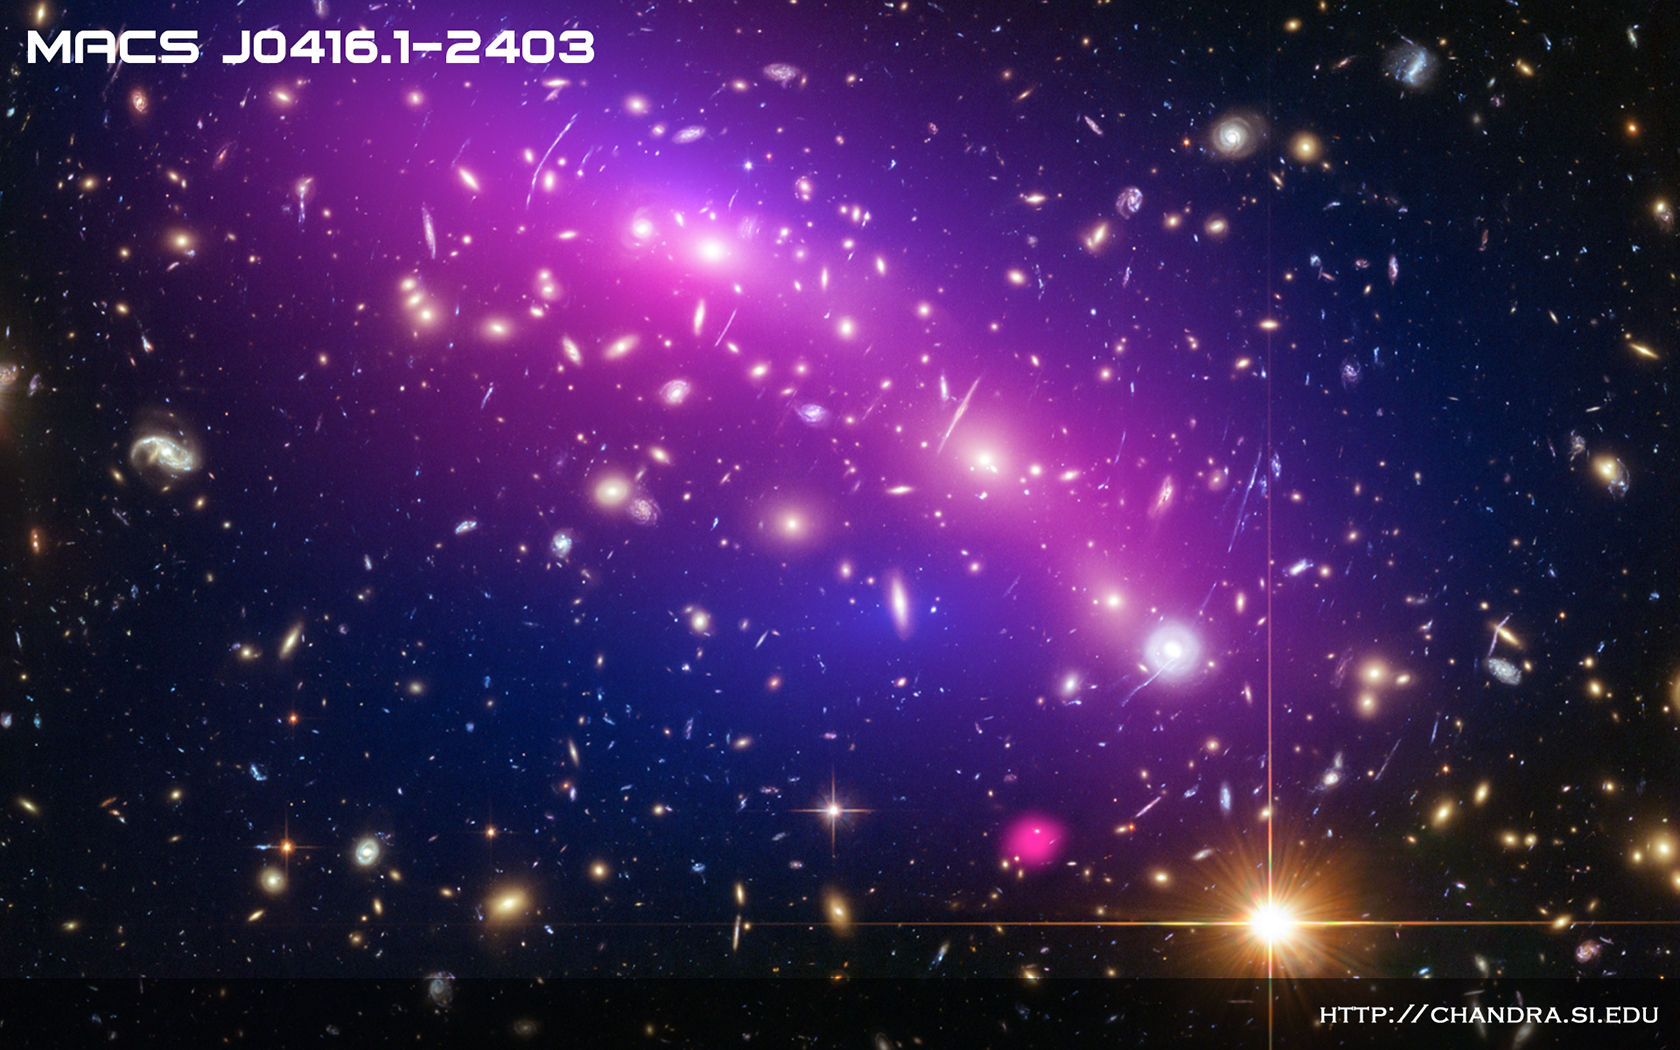
Because the clouds of gas are very hot — millions of degrees — they glow brightly in X-ray light (pink). When combined with visible-light images from Hubble, the team was able to map the post-collision distribution of stars and also of the dark matter (blue). Astronomers can map the distribution of dark matter by analyzing how the light from distant sources beyond the cluster is magnified and distorted by gravitational effects (known as "gravitational lensing.")

The collisions in the study happened at different times, and are seen from different angles - some from the side, and others head-on. The clusters in the panel are from left to right and top to bottom: MACS J0416.1-2403, MACS J0152.5-2852, MACS J0717.5+3745, Abell 370, Abell 2744 and ZwCl 1358+62.

This study builds on previous findings involving Chandra and other telescopes, namely the work on the Bullet Cluster and other individual galaxy cluster collisions.

NASA's Marshall Space Flight Center in Huntsville, Alabama, manages the Chandra program for NASA's Science Mission Directorate in Washington. The Smithsonian Astrophysical Observatory in Cambridge, Massachusetts, controls Chandra's science and flight operations.

Visual Description:

The image is a series of 6 astronomical data sets that each feature a galaxy cluster colored in bright blue, purple and pink hues. Each cluster has a slightly different shape and cloudy or gaseous looking texture, set on a backdrop of sparkling golden specks of light against a black background. Galaxy clusters, the largest objects in the Universe held together by their own gravity, are made up of three main components: stars, clouds of hot gas, and dark matter. When galaxy clusters collide, the clouds of gas enveloping the galaxies crash into each other and slow down or stop. The stars are much less affected by the drag from the gas and, because they occupy much less space, they glide past each other like ships passing in the night. Because the clouds of gas are very hot - millions of degrees - they glow brightly in X-ray light (pink) from NASA's Chandra X-ray Observatory. When combined with visible-light images from the Hubble Space Telescope, the team was able to map the post-collision distribution of stars and also of the dark matter (blue). Astronomers can map the distribution of dark matter by analyzing how the light from distant sources beyond the cluster is magnified and distorted by gravitational effects (known as "gravitational lensing."). The collisions in the study happened at different times, and are seen from different angles - some from the side, and others head-on. The clusters in the panel are from left to right and top to bottom: MACS J0416.1-2403, MACS J0152.5-2852, MACS J0717.5+3745, Abell 370, Abell 2744 and ZwCl 1358+62.


Fast Facts for MACS J0416.1-2403:
Credit  X-ray: NASA/CXC/Ecole Polytechnique Federale de Lausanne, Switzerland/D.Harvey & NASA/CXC/Durham Univ/R.Massey; Optical & Lensing Map: NASA, ESA, D. Harvey (Ecole Polytechnique Federale de Lausanne, Switzerland) and R. Massey (Durham University, UK)
Release Date  March 26, 2015
Scale  Image is 5.4 arcmin across. (About 5.7 million light years)
Category  Groups & Clusters of Galaxies
Coordinates (J2000)  RA 04h16m 09.90s | Dec -24° 03´ 58.00"
Constellation  Eridanus
Observation Dates  6 pointings between Jun 2009 and Dec 2014
Observation Time  90 hours 5 min (3 days 18 hours 5 min)
Obs. IDs  10446, 16236, 16237, 16304, 16523, 17313
Instrument  ACIS
References Harvey, D. et al, 2015, Science (in press)
Color Code  X-ray (Pink); Optical (Red, Green, Blue); Lensing Map (Blue)
Optical
X-ray
Distance Estimate  About 4.29 billion light years (z=0.396)
distance arrow
Fast Facts for MACS J0152.5-2852:
Credit  X-ray: NASA/CXC/Ecole Polytechnique Federale de Lausanne, Switzerland/D.Harvey & NASA/CXC/Durham Univ/R.Massey; Optical & Lensing Map: NASA, ESA, D. Harvey (Ecole Polytechnique Federale de Lausanne, Switzerland) and R. Massey (Durham University, UK)
Release Date  March 26, 2015
Scale  Image is 3 arcmin across. (About 3.2 million light years)
Category  Groups & Clusters of Galaxies
Coordinates (J2000)  RA 01h 52m 34.45s | Dec -28° 53´ 42.23"
Constellation  Fornax
Observation Dates  17 Sep 2002
Observation Time  5 hours
Obs. IDs  3264
Instrument  ACIS
References Harvey, D. et al, 2015, Science (in press)
Color Code  X-ray (Pink); Optical (Red, Green, Blue); Lensing Map (Blue)
Optical
X-ray
Distance Estimate  About 4.43 billion light years (z=0.413)
distance arrow
Fast Facts for MACSJ0717.5+3745:
Credit  X-ray: NASA/CXC/Ecole Polytechnique Federale de Lausanne, Switzerland/D.Harvey & NASA/CXC/Durham Univ/R.Massey; Optical & Lensing Map: NASA, ESA, D. Harvey (Ecole Polytechnique Federale de Lausanne, Switzerland) and R. Massey (Durham University, UK)
Release Date  March 26, 2015
Scale  Image is 4.5 arcmin across. (About 5.7 million light years)
Category  Groups & Clusters of Galaxies
Coordinates (J2000)  RA 07h17m 33s.80 | Dec +37° 45´ 20.02"
Constellation  Aurigae
Observation Dates  29 Jan 2001, 8 Jan 2003, 11-13 Dec 2013
Observation Time  68 hours (2 days 19 hours 55 min)
Obs. IDs  1655, 4200, 16235, 16305
Instrument  ACIS
References Harvey, D. et al, 2015, Science (in press)
Color Code  X-ray (Pink); Optical (Red, Green, Blue); Lensing Map (Blue)
Optical
X-ray
Distance Estimate  About 5.4 billion light years (z=0.545)
distance arrow
Fast Facts for Abell 370:
Credit  X-ray: NASA/CXC/Ecole Polytechnique Federale de Lausanne, Switzerland/D.Harvey & NASA/CXC/Durham Univ/R.Massey; Optical & Lensing Map: NASA, ESA, D. Harvey (Ecole Polytechnique Federale de Lausanne, Switzerland) and R. Massey (Durham University, UK)
Release Date  March 26, 2015
Scale  Image is 3 arcmin across. (About 3 million light years)
Category  Groups & Clusters of Galaxies
Coordinates (J2000)  RA 02h 39m 50.5s | Dec -01° 35´ 08.00"
Constellation  Cetus
Observation Dates  22 Oct 1999
Observation Time  24 hours 45 min (1 day 45 min)
Obs. IDs  515
Instrument  ACIS
References Harvey, D. et al, 2015, Science (in press)
Color Code  X-ray (Pink); Optical (Red, Green, Blue); Lensing Map (Blue)
Optical
X-ray
Distance Estimate  About 4.11 billion light years (z=0.375)
distance arrow
Fast Facts for Abell 2744:
Credit  X-ray: NASA/CXC/Ecole Polytechnique Federale de Lausanne, Switzerland/D.Harvey & NASA/CXC/Durham Univ/R.Massey; Optical & Lensing Map: NASA, ESA, D. Harvey (Ecole Polytechnique Federale de Lausanne, Switzerland) and R. Massey (Durham University, UK)
Release Date  March 26, 2015
Scale  Image is 7 arcmin across. (About 6 million light years)
Category  Groups & Clusters of Galaxies
Coordinates (J2000)  RA 00h 14m 19.51s | Dec -30° 23´ 19.18"
Constellation  Sculptor
Observation Dates  5 pointings between Sep 2001 and Sep 2007
Observation Time  35 hours 15 min (1 day 11 hours 15 min)
Obs. IDs  2212, 7712, 7915, 8477, 8557
Instrument  ACIS
References Harvey, D. et al, 2015, Science (in press)
Color Code  X-ray (Pink); Optical (Red, Green, Blue); Lensing Map (Blue)
Optical
X-ray
Distance Estimate  About 3.5 billion light years (z=0.308)
distance arrow
Fast Facts for ZwCl 1358+62:
Credit  X-ray: NASA/CXC/Ecole Polytechnique Federale de Lausanne, Switzerland/D.Harvey & NASA/CXC/Durham Univ/R.Massey; Optical & Lensing Map: NASA, ESA, D. Harvey (Ecole Polytechnique Federale de Lausanne, Switzerland) and R. Massey (Durham University, UK)
Release Date  March 26, 2015
Scale  Image is 3 arcmin across. (About 2.7 million light years)
Category  Groups & Clusters of Galaxies
Coordinates (J2000)  RA 13h 59m 50.60s | Dec +62° 31´ 04.00"
Constellation  Draco
Observation Dates  3 Sep 2000
Observation Time  15 hours 13 min
Obs. IDs  516
Instrument  ACIS
References Harvey, D. et al, 2015, Science (in press)
Color Code  X-ray (Pink); Optical (Red, Green, Blue); Lensing Map (Blue)
Optical
X-ray
Distance Estimate  About 3.72 billion light years (z=0.33)
distance arrow
Rate This Image

  • Currently 3.82/5
Rating: 3.8/5
(611 votes cast)
Download & Share

Desktops

1024x768 - 858.8 kb
1280x1024 - 1.3 MB
1680x1050 - 1.4 MB
More Information
More Images
X-ray Image of MACS J0416.1-2403
Jpg, Tif
click for larger image

More Images
Related Images
El Gordo
El Gordo
(3 Apr 14)
Bullet Cluster
Bullet Cluster
(30 Oct 08)

Related Information
Related Podcast
Top Rated Images
RACS J0320-35
  • Currently 4.39/5
MSH 15-52
  • Currently 4.17/5
Cassiopeia A
  • Currently 4.07/5


FaceBookTwitterYouTubeFlickr