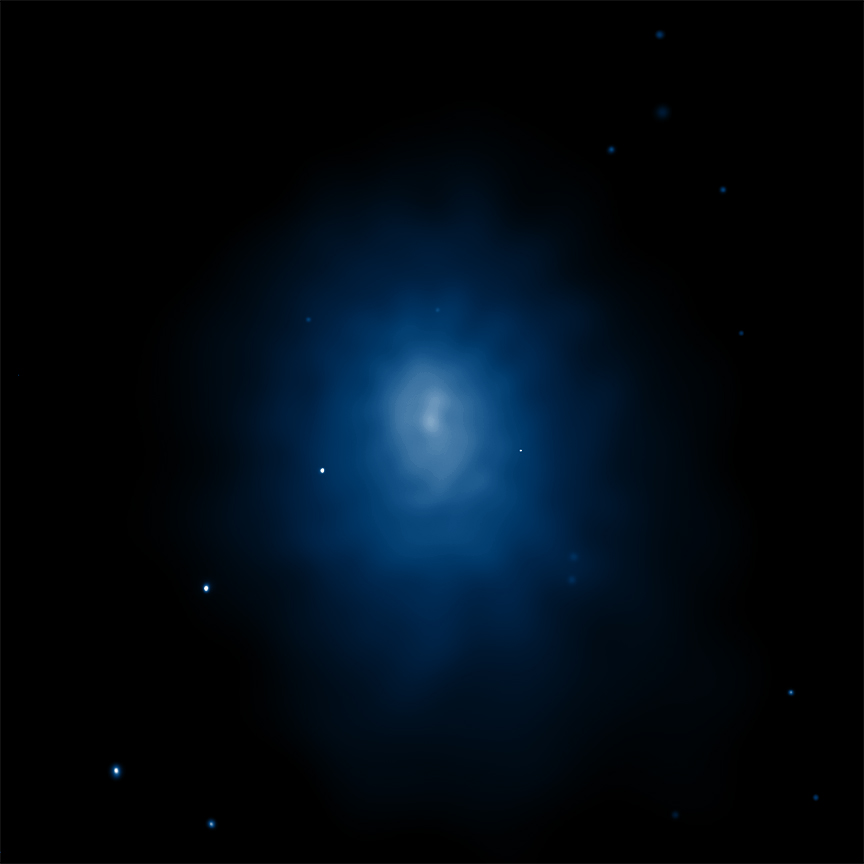
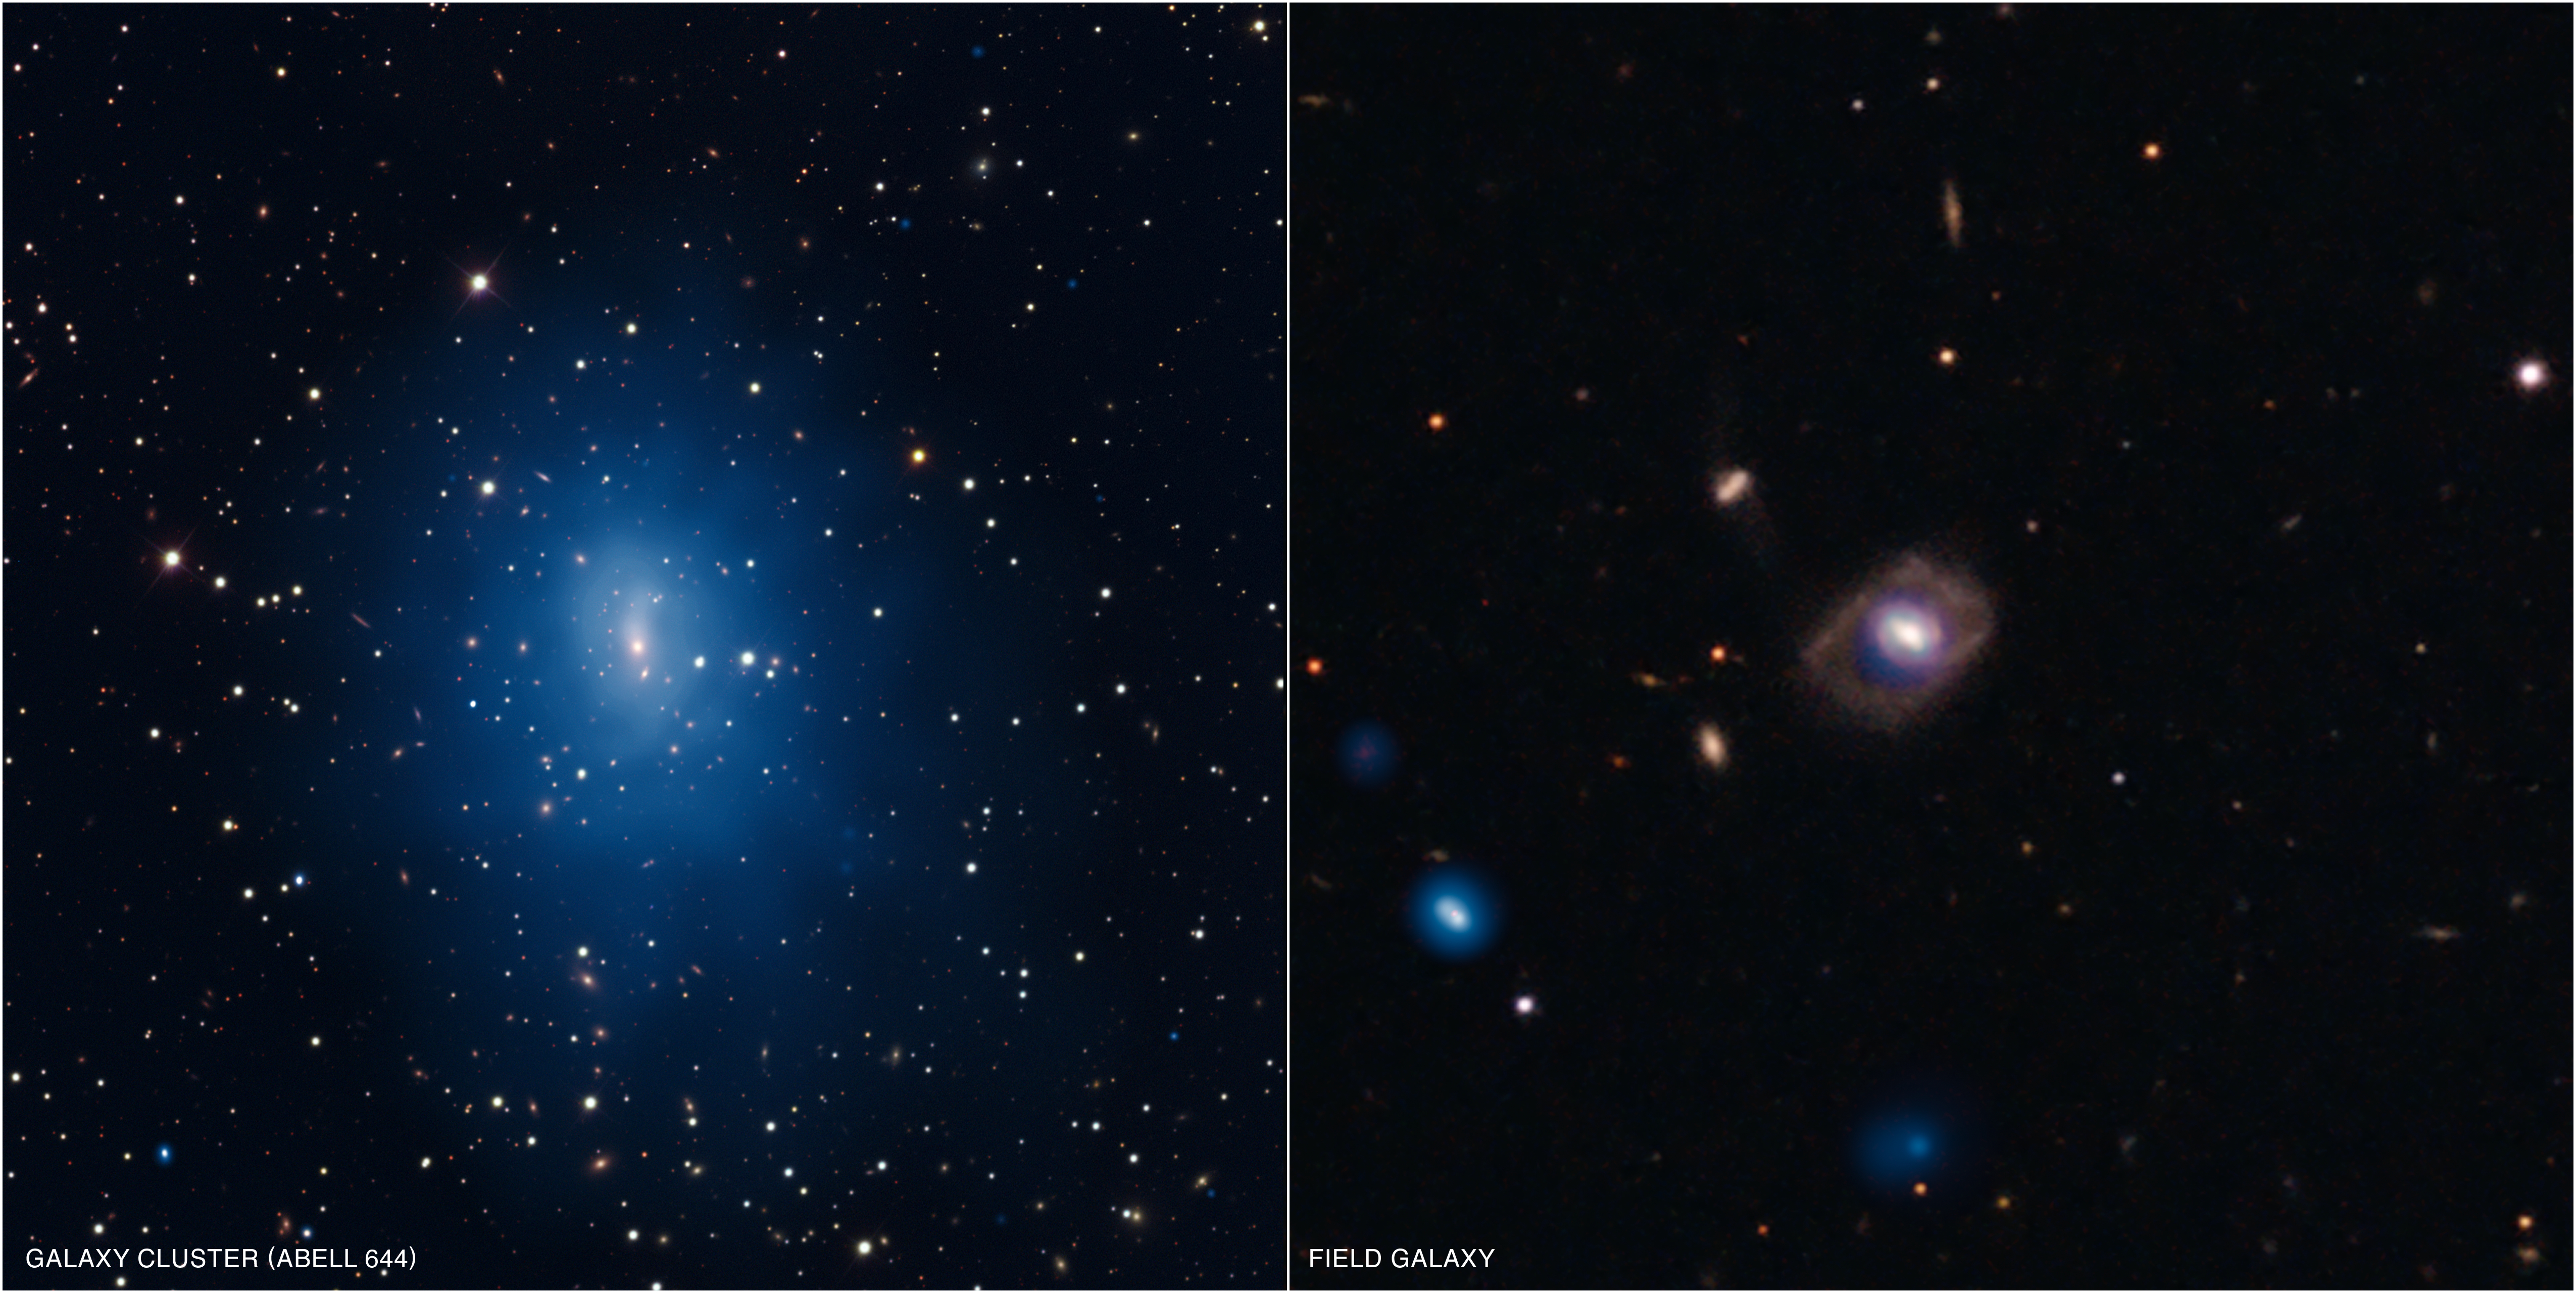
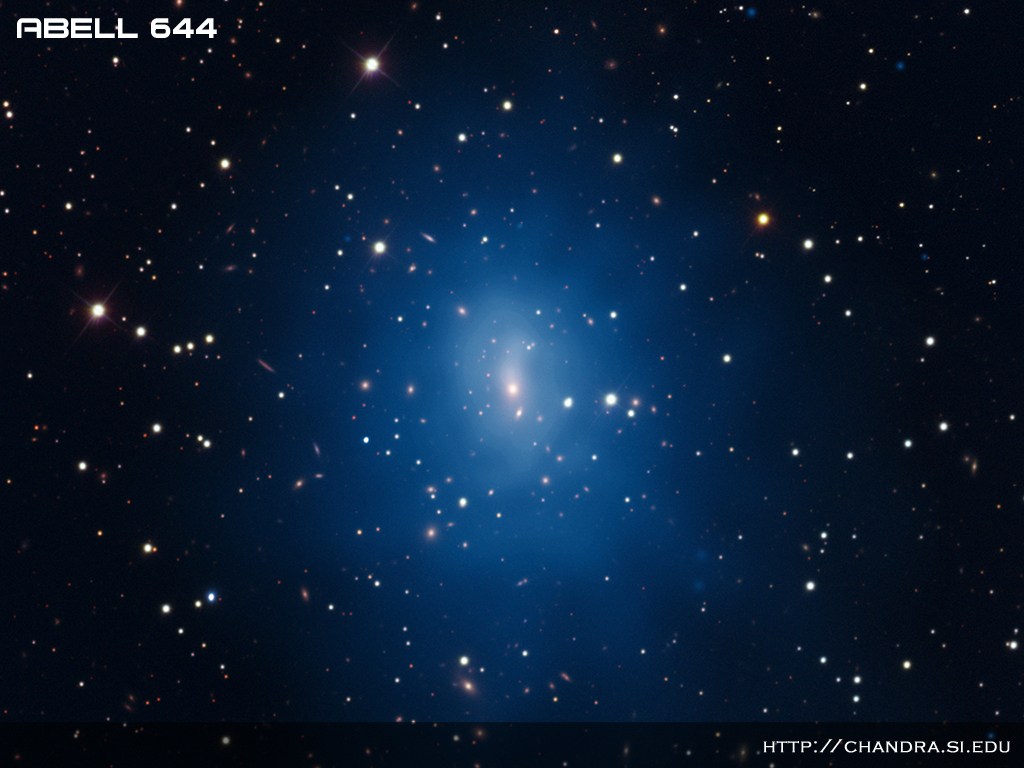
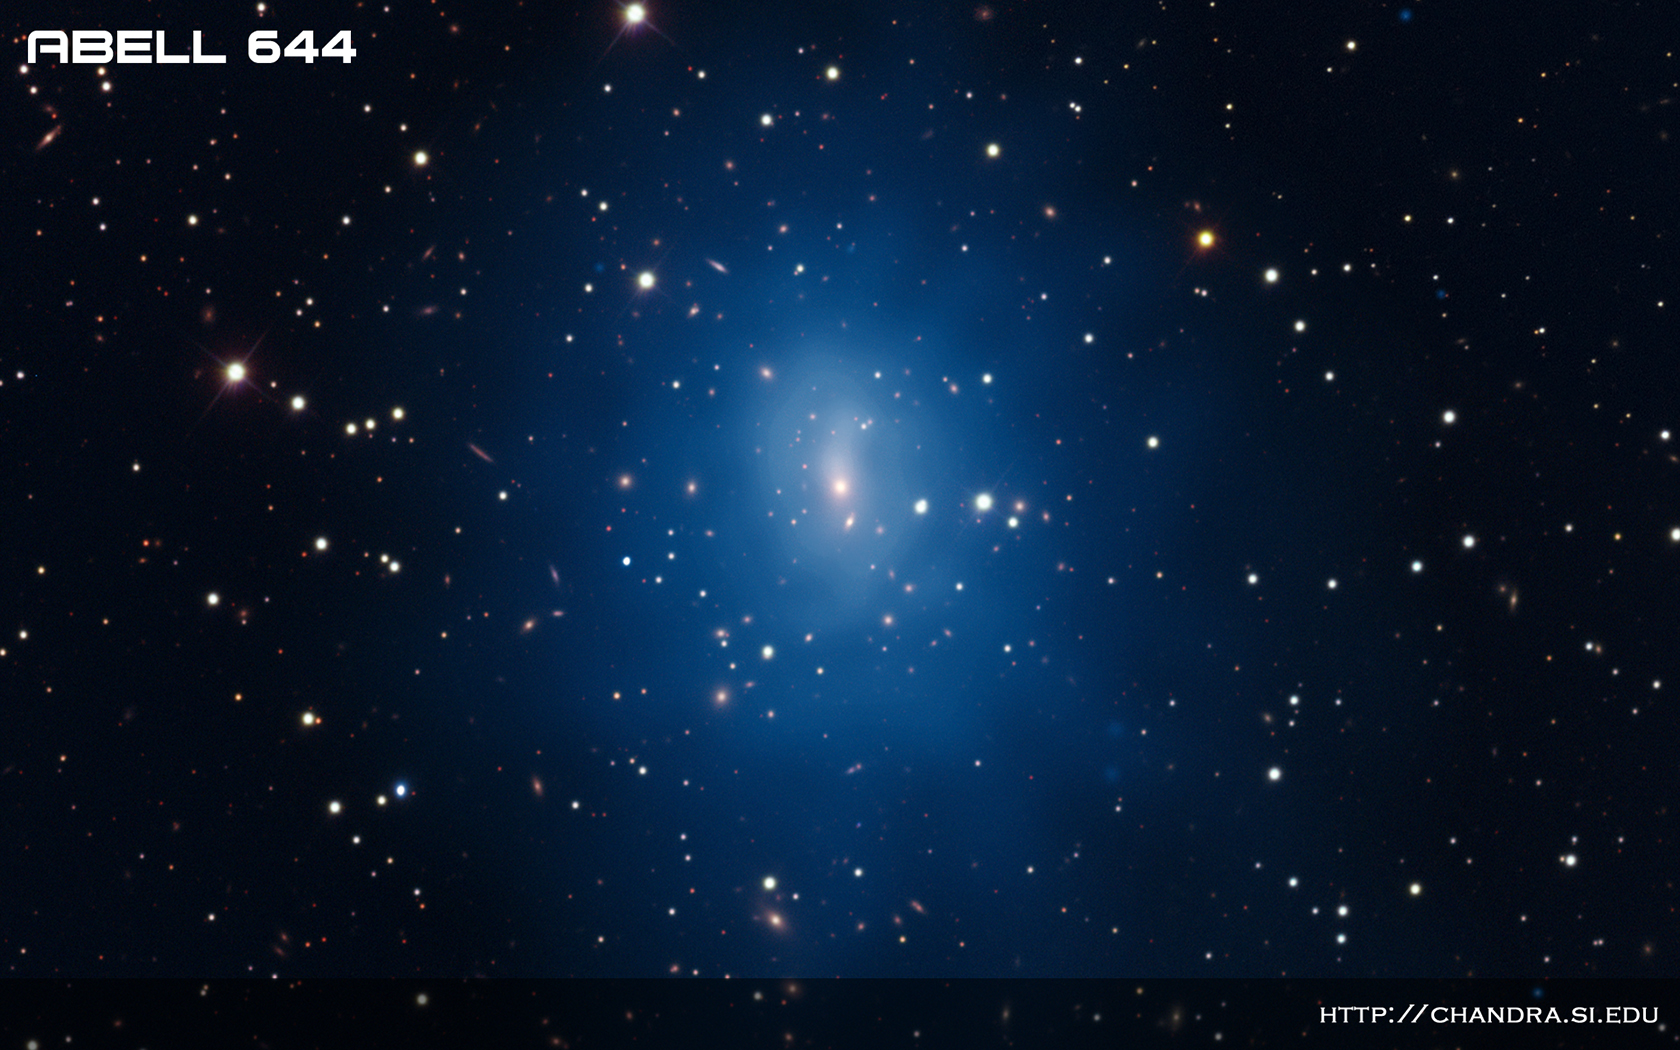
This two-panel graphic contains two composite images of galaxies used in a recent study of supermassive black holes. In each of the galaxies, data from NASA's Chandra X-ray Observatory are blue, and optical data from the Sloan Digital Sky survey are colored red, green and blue. The galaxy on the left, Abell 644, is in the center of a galaxy cluster that lies about 1.1 billion light years from Earth. On the right is an isolated, or "field," galaxy named XS04107B6_001, which is located about 900 million light years away. At the center of both of these galaxies is a growing supermassive black hole, called an active galactic nucleus (AGN) by astronomers, which is pulling in large quantities of gas.
A newly published study from Chandra tells scientists how often the biggest black holes in field galaxies like XS04107B6_001 have been active over the last few billion years. This has important implications for how environment affects black hole growth. The scientists found that only about one percent of field galaxies with masses similar to the Milky Way contain supermassive black holes in their most active phase. They also found that the most massive galaxies are the most likely to host these AGN, and that there is a gradual decline in the AGN fraction with cosmic time. Finally, the AGN fraction for field galaxies was found to be indistinguishable from that for galaxies in dense clusters, like Abell 644.
This study involves a survey called the Chandra Multiwavelength Project, or ChaMP, which covers 30 square degrees on the sky, the largest area covered of any Chandra survey to date. Combining Chandra's X-ray images with optical images from the Sloan Digital Sky Survey, about 100,000 galaxies were analyzed. Out of those, about 1,600 were bright in X-ray light, signaling possible AGN activity.
Visual Description:
The 2-panel composite image features optical and X-ray data of two galaxies. The dominant colors in the image are shades of blue and white, with a bit of dusky purple. In each of the galaxies, data from NASA's Chandra X-ray Observatory are blue, and optical data from the Sloan Digital Sky survey are colored mostly white, yellow and dusty purple. The galaxy on the left, Abell 644, is in the center of a galaxy cluster that lies about 1.1 billion light years from Earth. The galaxy looks like a very bright source in a sea of smaller bright spots with a large soft blue glow around it. On the right is an isolated galaxy named XS04107B6_001, which is located about 900 million light years away. This galaxy has very little blue glow and is a small irregular-looking spiral surrounded by a small smattering of other sources. At the center of both of these galaxies is a growing supermassive black hole, called an active galactic nucleus (AGN) by astronomers, which is pulling in large quantities of gas.
| Fast Facts for Abell 644: |
| Credit |
X-ray: NASA/CXC/Northwestern Univ/D.Haggard et al, Optical: SDSS |
| Release Date |
December 20, 2010 |
| Scale |
Image is 13.2 arcmin on a side (3.53 million light years)13.2 arcmin |
| Category |
Groups & Clusters of Galaxies Quasars & Active Galaxies |
| Coordinates (J2000) |
RA 08h 17m 25.6s | Dec -7° 30´ 45" |
| Constellation |
Hydra |
| Observation Date |
3/26/2001
|
| Observation Time |
8 hours 20 min |
| Obs. ID |
2211 |
| Instrument |
ACIS |
| References | Haggard, D. et al, 2010 ApJ 723:1447-1468 |
| Color Code |
X-ray (Blue), Optical (Red, Yellow, White) |
| Distance Estimate |
920 million light years (z=0.0701) |
|
| Fast Facts for SDSS J1021+1312: |
| Credit |
X-ray: NASA/CXC/Northwestern Univ/D.Haggard et al, Optical: SDSS |
| Release Date |
December 20, 2010 |
| Scale |
Image is 3.2 arcmin on a side (1.024 million light years)13.2 arcmin |
| Category |
Normal Galaxies & Starburst Galaxies Quasars & Active Galaxies |
| Coordinates (J2000) |
RA 10h 21m 47.86s | Dec +13° 12´ 28.19" |
| Constellation |
Hydra |
| Observation Date |
1/31/2003
|
| Observation Time |
2 hours 47 min |
| Obs. ID |
4107 |
| Instrument |
ACIS |
| References | Haggard, D. et al, 2010 ApJ 723:1447-1468 |
| Color Code |
X-ray (Blue), Optical (Red, Yellow, White) |
| Distance Estimate |
1.1 billion light years (z=0.085) |
|


