


CXC Home | Search | Help | Image Use Policy | Latest Images | Privacy | Accessibility | Glossary | Q&A
1
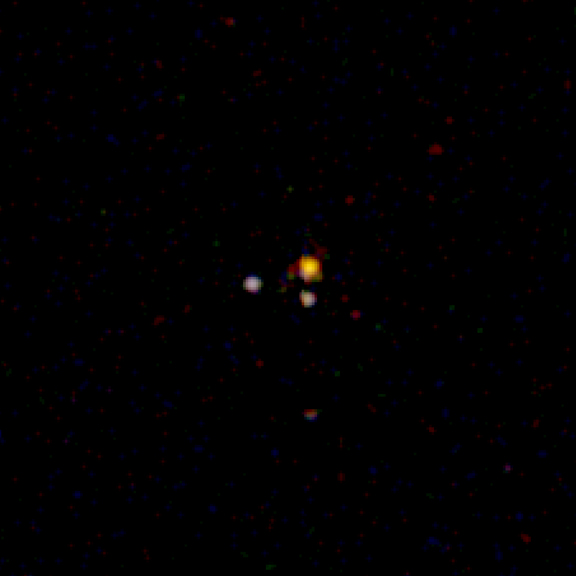
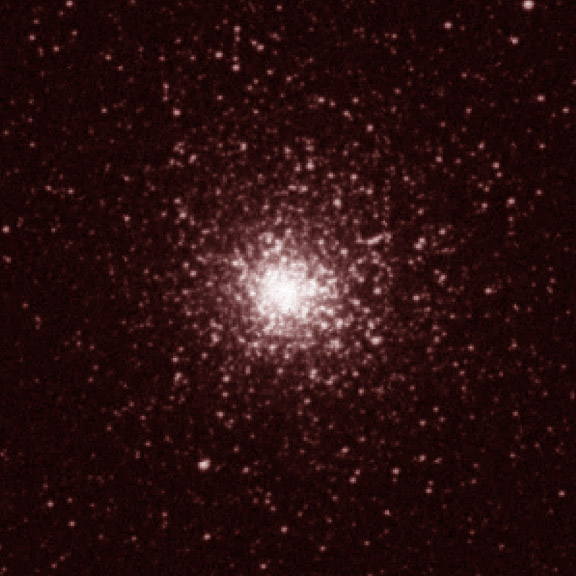
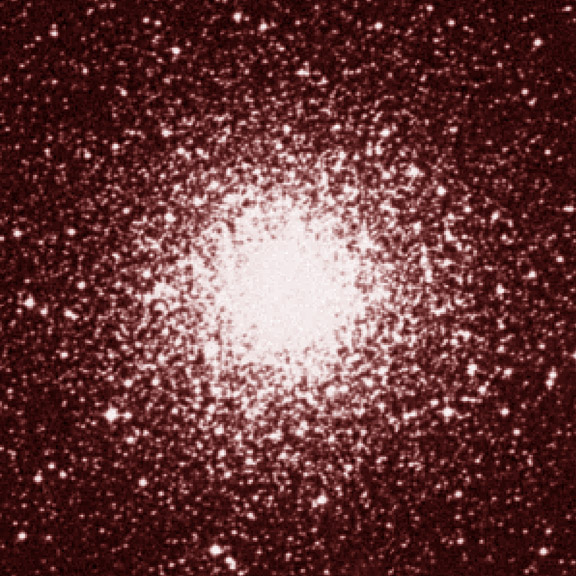
Chandra X-ray Image of NGC 6266
Globular cluster (also known as M62) where the stars are packed very closely together and the rate of close encounters between stars is high. NGC 6266 has more X-ray binaries than a globular cluster such as NGC 7099 in which close encounters occur less often. This is strong evidence that the X-ray binaries in globular clusters are formed by close encounters.
(Credit: NASA/CXC/MIT/D.Pooley et al.)
Scale: Image is approx. 2.5 arcmin on a side.
2
Chandra X-ray Image of NGC 7099
Globular cluster (also known as M30) in which close encounters between stars occur less often. NGC 7099 has less X-ray binaries than a globular cluster such as NGC 6266 in which the stars are packed very closely together and the rate of close encounters between stars is high.
(Credit: NASA/CXC/UIn/H.Cohn & P.Lugger et al.)
Scale: Image is approx. 2.5 arcmin on a side.
3
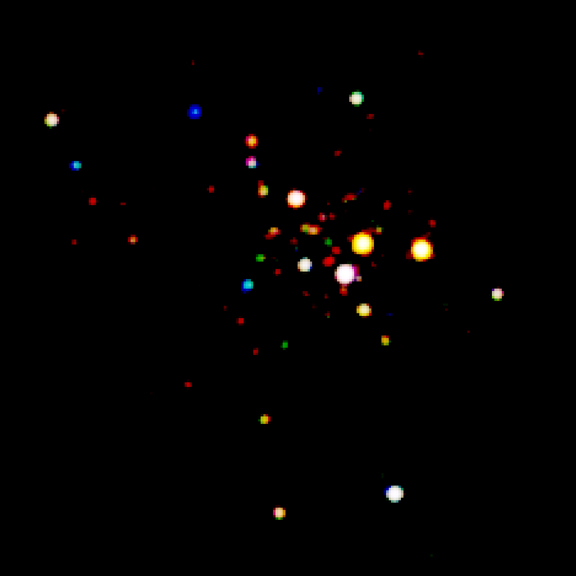
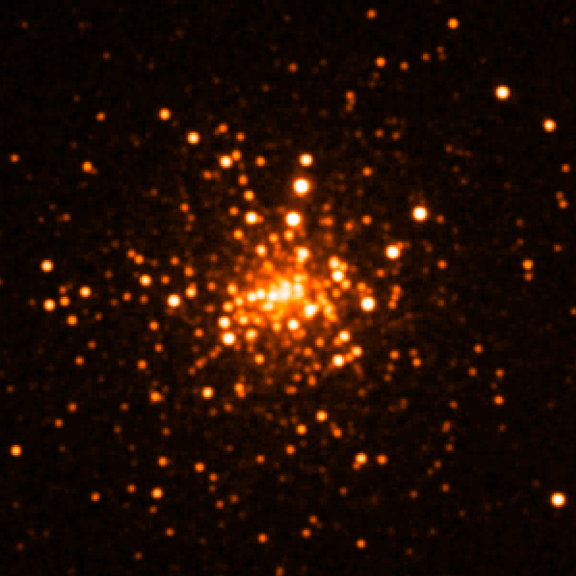
Chandra X-ray Image of 47 Tucanae
Chandra observations of this globular cluster, along with others in a recent study, provide a crucial clue to the origin of so-called X-ray binary sources. The Chandra data suggest a link between rate of stellar encounters in globular clusters and the number of X-ray binary systems that exist there. This observation of 47 Tuc (Obs. ID 953) was taken on March 16, 2000 for 8.9 hours with ACIS. The color is coded by energy: Red 0.5-1.2 keV, Green 1.2-2.5 keV, Blue 2.5-6 keV.
(Credit: NASA/CXC/CfA/J. Grindlay et al.)
Scale: Image is approx. 2.5 arcmin on a side.
4
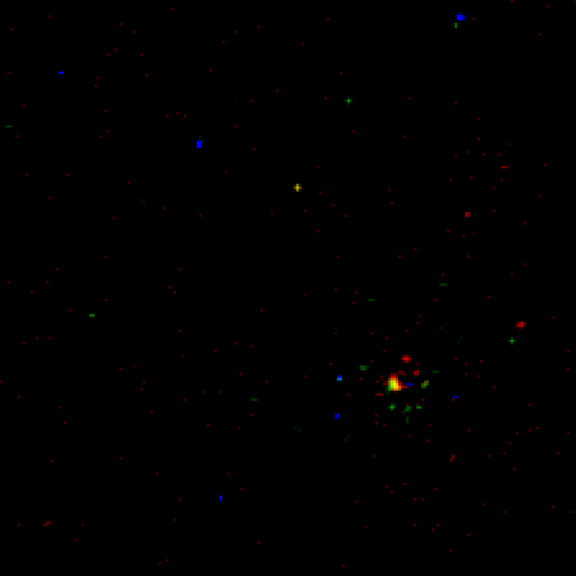
Chandra X-ray Image of NGC 6366
Chandra observations of this globular cluster, along with others in a recent study, provide a crucial clue to the origin of so-called X-ray binary sources. The Chandra data suggest a link between rate of stellar encounters in globular clusters and the number of X-ray binary systems that exist there. This observation of NGC 6366 (Obs. ID 2678) was taken on July 5, 2002 for 6.1 hours with ACIS. The color is coded by energy: Red 0.5-1.2 keV, Green 1.2-2.5 keV, Blue 2.5-6 keV.
(Credit: NASA/CXC/MIT/D.Pooley et al.)
Scale: Image is approx. 2.5 arcmin on a side.
5
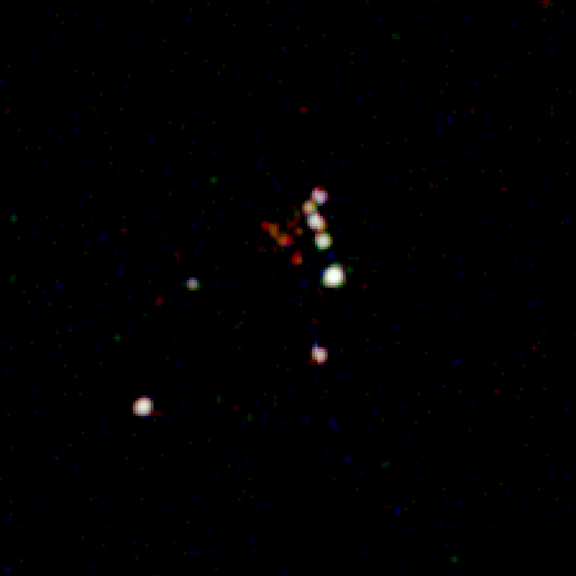
Chandra X-ray Image of NGC 6752
Chandra observations of this globular cluster, along with others in a recent study, provide a crucial clue to the origin of so-called X-ray binary sources. The Chandra data suggest a link between rate of stellar encounters in globular clusters and the number of X-ray binary systems that exist there. This observation of NGC 6752 (Obs. ID 948) was taken on May 15, 2000 for 8 hours with ACIS. The color is coded by energy: Red 0.5-1.2 keV, Green 1.2-2.5 keV, Blue 2.5-6 keV.
(Credit: NASA/CXC/MIT/D.Pooley et al.)
Scale: Image is approx. 2.5 arcmin on a side.
6
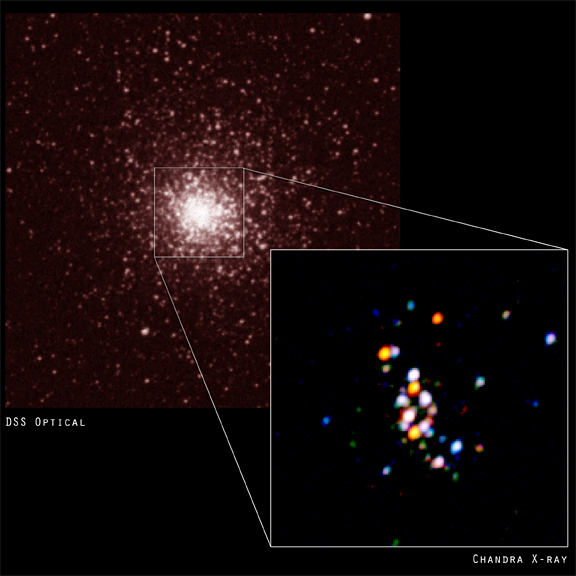
DSS Optical and Chandra X-ray Comparison of NGC 6266
A comparison between a Digitized Sky Survey (DSS) optical image and a Chandra X-ray image of the globular cluster NGC 6266. The DSS image shows normal stars and red giants and the Chandra image shows X-ray binary systems formed by close encounters between normal stars and collapsed stars. The Chandra data suggest a link between the rate of stellar encounters in globular clusters and the number of X-ray binary systems that exist there. Because the X-ray binary systems are heavier than most normal, single stars, they have sunk towards the center of NGC 6266.
(Credit: Optical: Pal.Obs. DSS; X-ray: NASA/CXC/MIT/D.Pooley et al.)
Scale: Chandra image is 1.9 arcmin on a side.
7
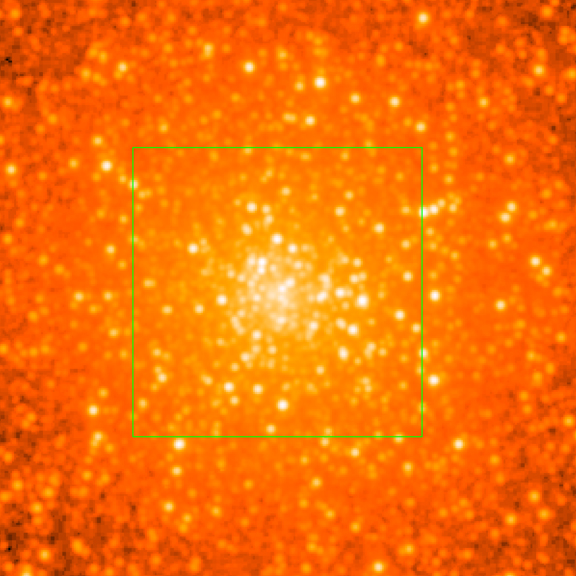
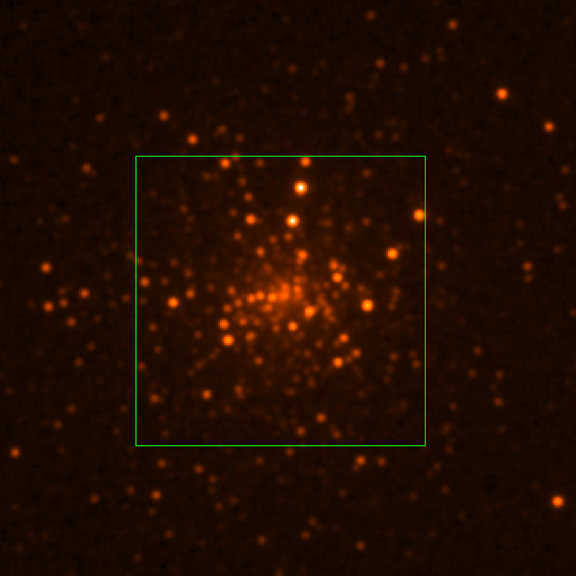
2MASS Infrared Image of NGC 6266
This 2MASS infrared image shows a wider field of view of globular cluster NGC 6266. The location of the 2.5 arcmin Chandra region is depicted by a square in the image to the right.
(Credit: 2MASS/UMass/IPAC-Caltech/NASA/NSF)
This 2MASS infrared image shows a wider field of view of globular cluster NGC 6266. The location of the 2.5 arcmin Chandra region is depicted by a square in the image to the right.
(Credit: 2MASS/UMass/IPAC-Caltech/NASA/NSF)
8
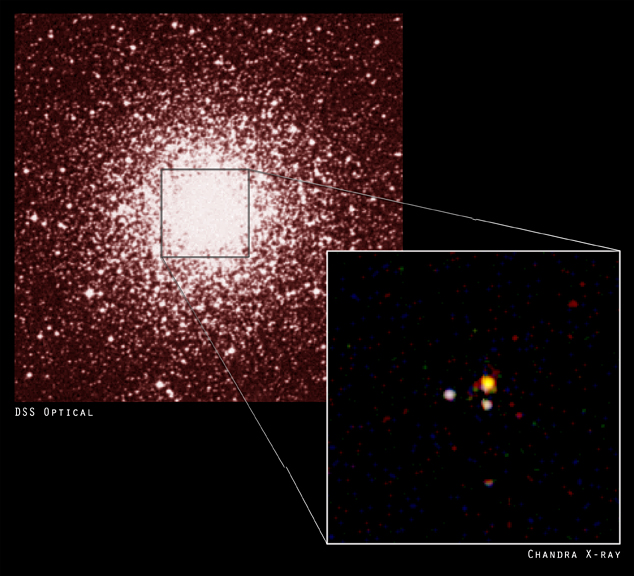
DSS Optical and Chandra X-ray Comparison of NGC 7099
A comparison between a Digitized Sky Survey (DSS) optical image and a Chandra X-ray image of the globular cluster NGC 7099 (M30). The DSS image shows normal stars and red giants and the Chandra image shows X-ray binary systems formed by close encounters between normal stars and collapsed stars. The Chandra data suggest a link between rate of stellar encounters in globular clusters and the number of X-ray binary systems that exist there. Because the X-ray binary systems are heavier than most normal, single stars, they have sunk towards the center of NGC 7099.
(Credit: Optical: Pal.Obs. DSS; X-ray: NASA/CXC/UIn/H.Cohn & P.Lugger et al.)
Scale: Chandra image is 1.9 arcmin on a side.
9
2MASS Infrared Image of NGC 7099
This 2MASS infrared image shows a wider field of view of globular cluster NGC 7099. The location of the 2.5 arcmin Chandra region is depicted by a square in the image to the right.
(Credit: 2MASS/UMass/IPAC-Caltech/NASA/NSF)
This 2MASS infrared image shows a wider field of view of globular cluster NGC 7099. The location of the 2.5 arcmin Chandra region is depicted by a square in the image to the right.
(Credit: 2MASS/UMass/IPAC-Caltech/NASA/NSF)
10
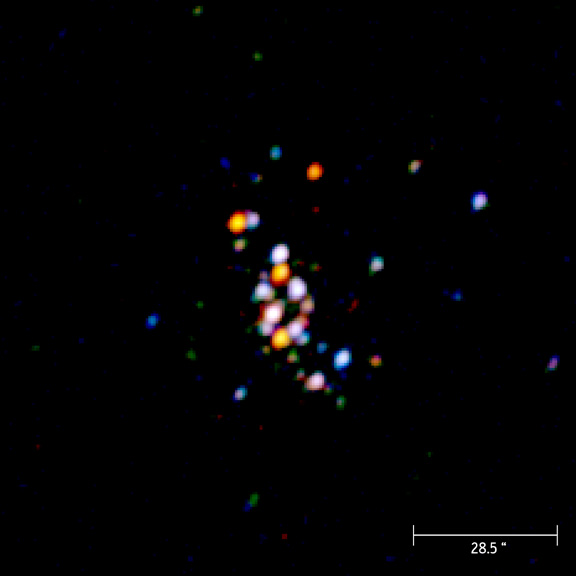
Chandra X-ray Image of NGC 6266 with Scale Bar
Scale bar = 28.5 arcsec
(Credit: NASA/CXC/MIT/D.Pooley et al.)
Scale bar = 28.5 arcsec
(Credit: NASA/CXC/MIT/D.Pooley et al.)
11
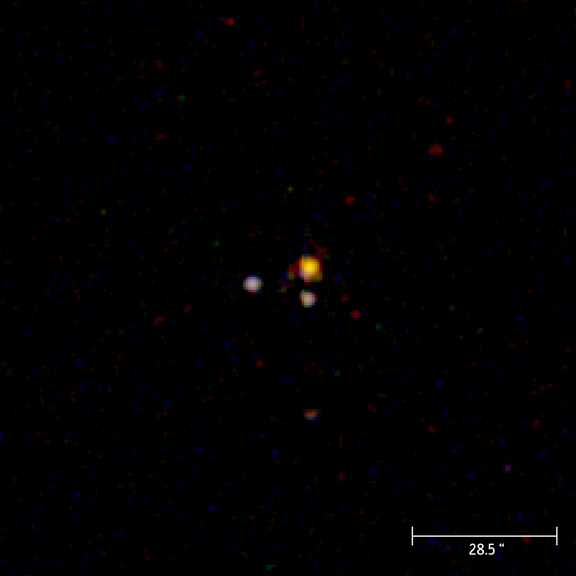
Chandra X-ray Image of NGC 7099 with Scale Bar
Scale bar = 28.5 arcsec
(Credit: NASA/CXC/UIn/H.Cohn & P.Lugger et al.)
Scale bar = 28.5 arcsec
(Credit: NASA/CXC/UIn/H.Cohn & P.Lugger et al.)
Return to NGC 6266 & NGC 7099 (30 Jul 03)
Revised: May 17, 2022