
CXC Home | Search | Help | Image Use Policy | Latest Images | Privacy | Accessibility | Glossary | Q&A
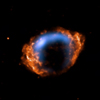
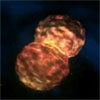
1. Comparison of X-ray and Radio Images
QuicktimeMPEG Broadcast:
In order to determine the age of G1.9+0.3, astronomers needed to track how quickly it is expanding. By comparing a radio image from 1985 to a Chandra image taken in 2007, scientists see the ring of debris expand. The expansion rate was confirmed with another radio observation with the VLA in 2008. The difference in size between these images gives clear evidence for expansion, allowing the age of the remnant and the time since the original supernova explosion (about 140 years) to be estimated.
[Runtime: 0.35]
(X-ray (NASA/CXC/NCSU/S.Reynolds et al.); Radio (NSF/NRAO/VLA/ Cambridge/D.Green et al.)
Related Chandra Images:
QuicktimeMPEG Broadcast:
- QuickTime movie (uncompressed)
- D1 (0.9 pixel aspect ratio)
- 720x486
- 29.97 fps
- file size = (1 GB)
In order to determine the age of G1.9+0.3, astronomers needed to track how quickly it is expanding. By comparing a radio image from 1985 to a Chandra image taken in 2007, scientists see the ring of debris expand. The expansion rate was confirmed with another radio observation with the VLA in 2008. The difference in size between these images gives clear evidence for expansion, allowing the age of the remnant and the time since the original supernova explosion (about 140 years) to be estimated.
[Runtime: 0.35]
(X-ray (NASA/CXC/NCSU/S.Reynolds et al.); Radio (NSF/NRAO/VLA/ Cambridge/D.Green et al.)
Related Chandra Images:
- Photo Album: G1.9+0.3
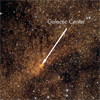
2. Zoom into G1.9+0.3
QuicktimeMPEG Broadcast:
Beginning with a wide-field look at the center of the Milky Way from the Two Micron All Sky Survey, the view zooms into the Galactic Center before panning about a thousand light years away to where G1.9+0.3 is located. While most optical light is blocked by thick clouds of gas and dust in this part of the Galaxy, X-ray and radio radiation can penetrate them. A combination of data from Chandra and the VLA allowed for the discovery of a recent supernova explosion that would have appeared in the night sky during the late 19th century if it was unobscured.
[Runtime: 0.35]
(X-ray (NASA/CXC/NCSU/S.Reynolds et al.); Radio (NSF/NRAO/VLA/ Cambridge/ D.Green et al.); Infrared (2MASS/UMass/IPAC-Caltech/NASA/NSF/CfA/E.Bressert)
Related Chandra Images:
QuicktimeMPEG Broadcast:
- QuickTime movie (uncompressed)
- D1 (0.9 pixel aspect ratio)
- 720x486
- 29.97 fps
- file size = (1 GB)
Beginning with a wide-field look at the center of the Milky Way from the Two Micron All Sky Survey, the view zooms into the Galactic Center before panning about a thousand light years away to where G1.9+0.3 is located. While most optical light is blocked by thick clouds of gas and dust in this part of the Galaxy, X-ray and radio radiation can penetrate them. A combination of data from Chandra and the VLA allowed for the discovery of a recent supernova explosion that would have appeared in the night sky during the late 19th century if it was unobscured.
[Runtime: 0.35]
(X-ray (NASA/CXC/NCSU/S.Reynolds et al.); Radio (NSF/NRAO/VLA/ Cambridge/ D.Green et al.); Infrared (2MASS/UMass/IPAC-Caltech/NASA/NSF/CfA/E.Bressert)
Related Chandra Images:
- Photo Album: G1.9+0.3
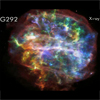
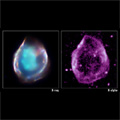
3. X-ray Images of G292.0+1.8
QuicktimeMPEG Chandra's image of G292.0+1.8 shows remarkable complexity and structure in the debris field of this exploded star. Each color represents different elements such as oxygen, neon, magnesium, and silicon. The distribution of these elements gives astronomers clues about how the star exploded. The view then zooms into the region around the dense core that remains of the star, seen in the highest-energy X-rays detected by Chandra.
[Runtime: 0:12]
(X-ray: NASA/CXC/Penn State/S.Park et al.; Optical: Pal.Obs. DSS)
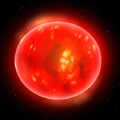
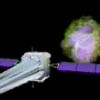
4. Animation of Star Collapse
QuicktimeMPEG Broadcast:
When the core of a massive star collapses, a supernova explosion occurs and the collapsed core forms an extremely compact, rapidly spinning neutron star. Some theories propose that the neutrons could dissolve into free quarks, causing the neutron star to shrink further and become a strange quark star. NASA has announced the detection of a possible strange quark star.
[Runtime: 0:33]
(CXC/D.Berry)
Related Chandra Images:
QuicktimeMPEG Broadcast:
- QuickTime movie (uncompressed)
- D1 (0.9 pixel aspect ratio)
- 720x486
- 29.97 fps
- file size = (1.1 GB)
When the core of a massive star collapses, a supernova explosion occurs and the collapsed core forms an extremely compact, rapidly spinning neutron star. Some theories propose that the neutrons could dissolve into free quarks, causing the neutron star to shrink further and become a strange quark star. NASA has announced the detection of a possible strange quark star.
[Runtime: 0:33]
(CXC/D.Berry)
Related Chandra Images:
- Photo Album: RX J1856.5-3754
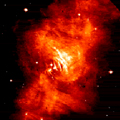
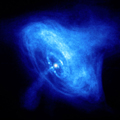
5. Chandra & The Crab Nebula
QuicktimeMPEG Broadcast:
Chandra's-eye view of the Crab nebula. First is a view of Chandra pointing toward the visible light image of the Crab nebula, and then zooming in with the X-ray view.
[Runtime: 0:06]
(NASA)
Related Chandra Images:
QuicktimeMPEG Broadcast:
- QuickTime movie (uncompressed)
- D1 (0.9 pixel aspect ratio)
- 720x486
- 29.97 fps
- file size = (452.5 MB)
Chandra's-eye view of the Crab nebula. First is a view of Chandra pointing toward the visible light image of the Crab nebula, and then zooming in with the X-ray view.
[Runtime: 0:06]
(NASA)
Related Chandra Images:
- Photo Album: Crab Nebula
6. DEM L71 Chandra Image Fade into Optical Image
QuicktimeMPEG Broadcast:
The outer rim of this supernova remnant denotes the blast wave moving out into the interstellar medium. This sequence, which shows the Chandra image fade into the optical equivalent, shows how the X-ray data is very similar to optical emission. DEM L71 presents a textbook example of the double-shock structure expected to develop when a star explodes and ejects matter at high speeds into the surrounding interstellar gas.
[Runtime: 0:06]
(X-ray: NASA/CXC/Rutgers/J. Hughes et al; Optical: Rutgers Fabry-Perot)
Related Chandra Images:
QuicktimeMPEG Broadcast:
- QuickTime movie (uncompressed)
- D1 (0.9 pixel aspect ratio)
- 720x486
- 29.97 fps
- file size = (300.3 MB)
The outer rim of this supernova remnant denotes the blast wave moving out into the interstellar medium. This sequence, which shows the Chandra image fade into the optical equivalent, shows how the X-ray data is very similar to optical emission. DEM L71 presents a textbook example of the double-shock structure expected to develop when a star explodes and ejects matter at high speeds into the surrounding interstellar gas.
[Runtime: 0:06]
(X-ray: NASA/CXC/Rutgers/J. Hughes et al; Optical: Rutgers Fabry-Perot)
Related Chandra Images:
- Photo Album: DEM L71
7. Hubble Time-Lapse Movie Of Crab Pulsar Wind
QuicktimeMPEG Broadcast:
The movie shows dynamic rings, wisps and jets of matter and antimatter around the pulsar in the Crab Nebula as observed in optical light by Hubble. The movie was made from 24 Hubble observations made between August 2000 and April 2001. To produce a movie of reasonable length the sequence was looped several times, as in looped weather satellite images.
[Runtime: 0:19]
(NASA/HST/ASU/J.Hester et al.)
Related Chandra Images:
QuicktimeMPEG Broadcast:
- QuickTime movie (uncompressed)
- D1 (0.9 pixel aspect ratio)
- 720x486
- 29.97 fps
- file size = (599.6 MB)
The movie shows dynamic rings, wisps and jets of matter and antimatter around the pulsar in the Crab Nebula as observed in optical light by Hubble. The movie was made from 24 Hubble observations made between August 2000 and April 2001. To produce a movie of reasonable length the sequence was looped several times, as in looped weather satellite images.
[Runtime: 0:19]
(NASA/HST/ASU/J.Hester et al.)
Related Chandra Images:
- Photo Album: Crab Nebula
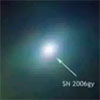
8. SN 2006gy Image Sequence
QuicktimeMPEG This sequence of images begins with an infrared image from the PAIRITEL telescope centered on NGC 1260. We then zoom into the middle of this galaxy and show an infrared adaptive optics image from Lick Observatory. The nucleus of the galaxy and the supernova SN 2006gy are labelled. The Chandra image is then shown, again showing the nucleus of NGC 1260 and SN 2006gy. The Chandra observation allowed the team to rule out the most likely alternative explanation for the explosion. If the supernova was caused by a white dwarf star exploding into a dense, hydrogen-rich environment, rather than the collapse of a massive star, SN 2006gy should have been about 1,000 times brighter in X-rays than what Chandra detected.
[Runtime: 0:26]
(X-ray: NASA/CXC/UC Berkeley/N.Smith et al.; IR: Lick/UC Berkeley/J.Bloom & C.Hansen)
9. Animation of SN 2006gy
QuicktimeMPEG This animation shows an artist's rendition of how SN 2006gy exploded. The extremely massive star shed some of its outer layers in a large eruption prior to its violent collapse. The explosion then plows into the expelled cooler gas, creating a brilliant light show. Astronomers think Eta Carinae in the Milky Way could explode in the same way at any time.
[Runtime: 0:22]
(NASA/G.Bacon)
Related Chandra Images:
- Photo Album: SN 2006gy
10. Chandra Time-Lapse Movie Of Crab Pulsar Wind
QuicktimeMPEG Broadcast:
The movie shows dynamic rings, wisps and jets of matter and antimatter around the pulsar in the Crab Nebula as observed in X-ray light by Chandra. The movie was made from 7 still images of Chandra observations taken between November 2000 and April 2001. To produce a movie of reasonable length the sequence was looped several times, as in looped weather satellite images. The inner ring is about one light year across.
[Runtime: 0:15]
(NASA/CXC/ASU/J.Hester et al.)
Related Chandra Images:
QuicktimeMPEG Broadcast:
- QuickTime movie (uncompressed)
- D1 (0.9 pixel aspect ratio)
- 720x486
- 29.97 fps
- file size = (599.6 MB)
The movie shows dynamic rings, wisps and jets of matter and antimatter around the pulsar in the Crab Nebula as observed in X-ray light by Chandra. The movie was made from 7 still images of Chandra observations taken between November 2000 and April 2001. To produce a movie of reasonable length the sequence was looped several times, as in looped weather satellite images. The inner ring is about one light year across.
[Runtime: 0:15]
(NASA/CXC/ASU/J.Hester et al.)
Related Chandra Images:
- Photo Album: Crab Nebula
Revised: March 24, 2023