
CXC Home | Search | Help | Image Use Policy | Latest Images | Privacy | Accessibility | Glossary | Q&A
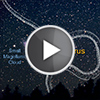
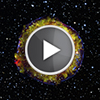
1. A Zoom into Supernova 1987A
QuicktimeMPEG The video begins with a nighttime view of the Small and Large Magellanic clouds, satellite galaxies of our Milky Way. It then zooms into a rich star-birth region in the Large Magellanic Cloud. Nestled between mountains of red-colored gas is the odd-looking structure of Supernova 1987A, the remnant of an exploded star that was first observed in February 1987. The site of the supernova is surrounded by a ring of material that is illuminated by a wave of energy from the outburst. Two faint outer rings are also visible. All three rings existed before the explosion as fossil relics of the doomed star's activity in its final days.
[Runtime: 00:33]
(NASA/CXC/A. Hobart)
Related Chandra Images:
- Photo Album: Supernova 1987A
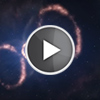
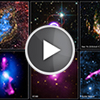
2. The material around SN 1987A (artist's impression)
QuicktimeMPEG This artist's impression of the material around a recently exploded star, known as Supernova 1987A (or SN 1987A), is based on observations which have for the first time revealed a three dimensional view of the distribution of the expelled material. The observations were made by astronomers using ESO's Very Large Telescope. The original blast was not only powerful, according to the new results. It was also more concentrated in one particular direction. This is a strong indication that the supernova must have been very turbulent, supporting the most recent computer models. This video shows the different elements present in SN 1987A: two outer rings, one inner ring and the deformed, innermost expelled material.
Just how a supernova explodes is not very well understood, but the way the star exploded is imprinted on this inner material. The astronomers could deduce that this material was not ejected symmetrically in all directions, but rather seems to have had a preferred direction. Besides, this direction is different to what was expected from the position of the rings.
[Runtime: 00:31]
(NASA/CXC/A. Hobart)
Related Chandra Images:
- Photo Album: Supernova 1987A

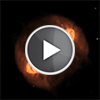
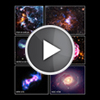
3. Chandra X-ray Time-lapse movie of SN 1987A
QuicktimeMPEG From 1999 until 2013, Chandra data showed an expanding ring of X-ray emission that had been steadily getting brighter. This was produced by the blast wave from the original explosion that had been bursting through and heating the ring of gas surrounding the supernova. In the past few years, there have been striking changes in the Chandra data. This provides evidence that the explosion's blast wave has moved beyond the ring into a region with less dense gas. This represents the end of an era for SN 1987A. Since astronomers do not know exactly lies beyond the ring, they will be watching carefully what happens next.
[Runtime: 00:22]
(NASA/CXC/A. Hobart)
Related Chandra Images:
- Photo Album: Supernova 1987A
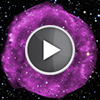
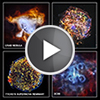
4. 3D Visualization of SN 1987A
QuicktimeMPEG This video shows a visualization of SN 1987A and the evolution of the resulting supernova remnant up until the present day. The visualization begins by showing the progenitor star surrounded by a ring of gas produced late in the life of the star. A flash of light depicts the supernova explosion, followed by expansion of the subsequent blast wave. The blast wave then collides with the ring of gas, causing high-density knots of material to become hotter and brighter, and lower-density gas to be blown outward. One frame is shown per year and the visualization steps between them at four years per second. Upon reaching the present day (February 2017), the time development is halted, and the camera circles around the ring to show its structure.
This visualization is based on a sophisticated 3D simulation published by Salvatore Orlando that incorporates the physics of SN 1987A, including the complex interaction between radiation and matter and relativistic effects. The simulation reproduces the observed properties of the supernova, including how the radiation, temperature and velocity of the debris vary with time. The simulation then reproduces the properties of the subsequent supernova remnant, including how the shape of the X-ray structure, as well as the amount of X-rays observed at different wavelengths, evolve with time.
[Runtime: 00:22]
(NASA/CXC/A. Hobart)
Related Chandra Images:
- Photo Album: Supernova 1987A
5. Radio Time-lapse of Tycho's Supernova Remnan
QuicktimeMPEG With some 30 years of observations in radio waves with the VLA, astronomers have also produced a movie, using three different images. Astronomers have used the X-ray and radio data to learn new things about this supernova and its remnant.
[Runtime: 00:02]
(NSF/NRAO/VLA)
Related Chandra Images:
- Photo Album: Tycho's Supernova Remnant
6. Chandra X-ray Time-lapse of Tycho's Supernova Remnant
QuicktimeMPEG By combining observations from over 15 years with the Chandra X-ray Observatory and 30 years with the Very Large Array, scientists have been able to learn new things about Tycho's supernova remnant and the explosion that created it. This time-lapse movie shows the expansion of the Tycho remnant, allowing a detailed study of how the debris field is expanding. In a series of five images from Chandra taken between 2000 and 2015, low-energy X-rays are red, the medium band of X-rays is green, and the highest-energy X-rays Chandra detected are blue.
[Runtime: 00:02]
(NASA/CXC/GSFC/B.Williams et al;)
Related Chandra Images:
- Photo Album: Tycho's Supernova Remnant
7. Banking X-ray Data for the Future
QuicktimeMPEG Audio Only
Archives, in their many forms, save information from today that people will want to access and study in the future. This is a critical function of all archives, but it is especially important when it comes to storing data from today's modern telescopes.
NASA's Chandra X-ray Observatory has collected data for over sixteen years on thousands of different objects throughout the Universe. The science team has immediate access to the data, and then a year after observation all of the data goes into a public archive where it can be folded into later studies.
To celebrate October being American Archive Month a collection of images from the Chandra archive is being released. Some of these objects may be familiar to readers, while others may be unknown. None of these images, in the exact form, has been released before.
By combining data from different observation dates, new perspectives of cosmic objects can be created. With archives like those from Chandra and other major observatories, such vistas will be available for future exploration.
[Runtime: 01:27]
(NASA/CXC/A. Hobart)
Related Chandra Images:
QuicktimeMPEG Audio Only
- Audio (1.1 MB)
Archives, in their many forms, save information from today that people will want to access and study in the future. This is a critical function of all archives, but it is especially important when it comes to storing data from today's modern telescopes.
NASA's Chandra X-ray Observatory has collected data for over sixteen years on thousands of different objects throughout the Universe. The science team has immediate access to the data, and then a year after observation all of the data goes into a public archive where it can be folded into later studies.
To celebrate October being American Archive Month a collection of images from the Chandra archive is being released. Some of these objects may be familiar to readers, while others may be unknown. None of these images, in the exact form, has been released before.
By combining data from different observation dates, new perspectives of cosmic objects can be created. With archives like those from Chandra and other major observatories, such vistas will be available for future exploration.
[Runtime: 01:27]
(NASA/CXC/A. Hobart)
Related Chandra Images:
- Photo Album: Chandra Archive Collection
8. Chandra's Archives Come to Life
QuicktimeMPEG Audio Only
Every year, NASA's Chandra X-ray Observatory looks at hundreds of objects throughout space to help expand our understanding of the Universe. Ultimately, these data are stored in the Chandra Data Archive, an electronic repository that provides access to these unique X-ray findings for anyone who would like to explore them. With the passing of Chandra's 15th anniversary, in operation since August 26, 1999, the archive continues to grow as each successive year adds to the enormous and invaluable dataset.
To celebrate Chandra's decade and a half in space, and to honor October as American Archive Month, a variety of objects have been selected from Chandra's archive. Each of the new images we have produced combines Chandra data with those from other telescopes. This technique of creating "multiwavelength" images allows scientists and the public to see how X-rays fit with data of other types of light, such as optical, radio, and infrared. As scientists continue to make new discoveries with the telescope, the burgeoning archive will allow us to see the high-energy Universe as only Chandra can.
[Runtime: 01:27]
(NASA/CXC/A. Hobart)
Related Chandra Images:
QuicktimeMPEG Audio Only
- Audio (1.2 MB)
Every year, NASA's Chandra X-ray Observatory looks at hundreds of objects throughout space to help expand our understanding of the Universe. Ultimately, these data are stored in the Chandra Data Archive, an electronic repository that provides access to these unique X-ray findings for anyone who would like to explore them. With the passing of Chandra's 15th anniversary, in operation since August 26, 1999, the archive continues to grow as each successive year adds to the enormous and invaluable dataset.
To celebrate Chandra's decade and a half in space, and to honor October as American Archive Month, a variety of objects have been selected from Chandra's archive. Each of the new images we have produced combines Chandra data with those from other telescopes. This technique of creating "multiwavelength" images allows scientists and the public to see how X-rays fit with data of other types of light, such as optical, radio, and infrared. As scientists continue to make new discoveries with the telescope, the burgeoning archive will allow us to see the high-energy Universe as only Chandra can.
[Runtime: 01:27]
(NASA/CXC/A. Hobart)
Related Chandra Images:
- Photo Album: Chandra Archive Collection
9. NASA's Chandra X-ray Observatory Celebrates 15th Anniversary
QuicktimeMPEG Audio Only
To celebrate the 15th anniversary of NASA's Chandra X-ray Observatory, we have released four new images of supernova remnants. These show Chandra's ability to study the remains of supernova explosions, using images that are the sharpest available in X-ray astronomy. The images of the Tycho and G292.0+1.8 supernova remnants show how Chandra can trace the expanding debris of an exploded star. The images show shock waves, similar to sonic booms from a supersonic plane, that travel through space at speeds of millions of miles per hour. The images of the Crab Nebula and 3C58 show the effects of very dense, rapidly spinning neutron stars created when a massive star explodes. These neutron stars can create clouds of high-energy particles that glow brightly in X-rays. The image for G292 shows oxygen (yellow and orange), and other elements such as magnesium (green) and silicon and sulfur (blue) that were forged in the star before it exploded. For the other images, the lower energy X-rays are shown in red and green and the highest energy X-rays are shown in blue.
[Runtime: 01:42]
(NASA/CXC/April Jubett)
Related Chandra Images:
QuicktimeMPEG Audio Only
- Audio (1.4 MB)
To celebrate the 15th anniversary of NASA's Chandra X-ray Observatory, we have released four new images of supernova remnants. These show Chandra's ability to study the remains of supernova explosions, using images that are the sharpest available in X-ray astronomy. The images of the Tycho and G292.0+1.8 supernova remnants show how Chandra can trace the expanding debris of an exploded star. The images show shock waves, similar to sonic booms from a supersonic plane, that travel through space at speeds of millions of miles per hour. The images of the Crab Nebula and 3C58 show the effects of very dense, rapidly spinning neutron stars created when a massive star explodes. These neutron stars can create clouds of high-energy particles that glow brightly in X-rays. The image for G292 shows oxygen (yellow and orange), and other elements such as magnesium (green) and silicon and sulfur (blue) that were forged in the star before it exploded. For the other images, the lower energy X-rays are shown in red and green and the highest energy X-rays are shown in blue.
[Runtime: 01:42]
(NASA/CXC/April Jubett)
Related Chandra Images:
- Photo Album: 3C 58
10. Smithsonian X 3D Explorer
QuicktimeMPEG Audio Only
One of the most famous objects in the sky – the Cassiopeia A supernova remnant – is now on display like never before, thanks to NASA's Chandra X-ray Observatory and a new project from the Smithsonian Institution. A new 3D viewer developed by the Smithsonian allows users to interact with one-of-a-kind objects like the Wright Brothers airplane and a 1,600-year-old stone Buddha. The only astronomical object in this special collection is Cassiopeia A, or Cas A for short.
Back in 2009, scientists combined data from Chandra, NASA's Spitzer Space Telescope, and ground-based facilities to construct a unique 3D model of Cas A, which is a 300-year old debris field that was created when as a massive star exploded. This new Smithsonian viewer will allow scientists and the public to tour this 3D model Cas A in exciting new ways by being able to fly around the remnant themselves. Users can also get more information about various parts of the supernova remnant by clicking on hotspots and following links to more in-depth articles. So we invite you to take a 3D ride unlike any you'll find at the movie theater and explore Cas A in in a brand new one way.
[Runtime: 02:09]
(NASA/CXC/April Jubett)
Related Chandra Images:
QuicktimeMPEG Audio Only
- Audio (1.3 MB)
One of the most famous objects in the sky – the Cassiopeia A supernova remnant – is now on display like never before, thanks to NASA's Chandra X-ray Observatory and a new project from the Smithsonian Institution. A new 3D viewer developed by the Smithsonian allows users to interact with one-of-a-kind objects like the Wright Brothers airplane and a 1,600-year-old stone Buddha. The only astronomical object in this special collection is Cassiopeia A, or Cas A for short.
Back in 2009, scientists combined data from Chandra, NASA's Spitzer Space Telescope, and ground-based facilities to construct a unique 3D model of Cas A, which is a 300-year old debris field that was created when as a massive star exploded. This new Smithsonian viewer will allow scientists and the public to tour this 3D model Cas A in exciting new ways by being able to fly around the remnant themselves. Users can also get more information about various parts of the supernova remnant by clicking on hotspots and following links to more in-depth articles. So we invite you to take a 3D ride unlike any you'll find at the movie theater and explore Cas A in in a brand new one way.
[Runtime: 02:09]
(NASA/CXC/April Jubett)
Related Chandra Images:
- Photo Album: Cassiopeia A
Revised: March 24, 2023