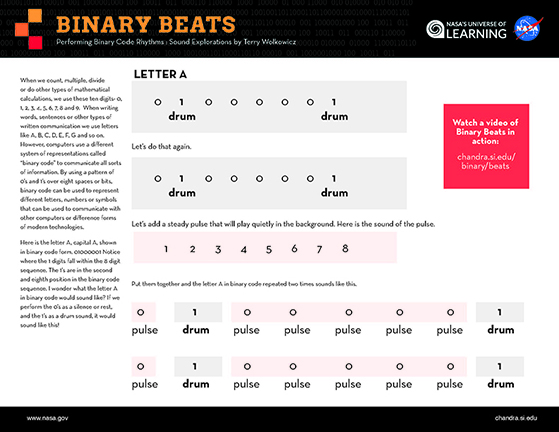
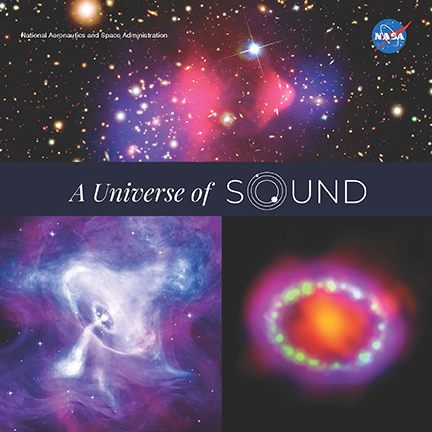
Much of our Universe is too distant for anyone to visit in person, but we can still explore it. Telescopes give us a chance to understand what objects in our Universe are like in different types of light. By translating the inherently digital data (in the form of ones and zeroes) captured by telescopes in space into images, astronomers can create visual representations of what would otherwise be invisible to us.
But what about experiencing these data with other senses, like hearing? Sonification is the process that translates data into sound. Our new project brings parts of our Milky Way galaxy, and of the greater Universe beyond it, to listeners for the first time.
Learn more about the Sonification Project | Try sonification yourself | Play NASA data | Watch the NASA+ documentary | Visit the SN1987a Interactive Sonification

Learn more and listen
Galaxy Center
Learn more and listen
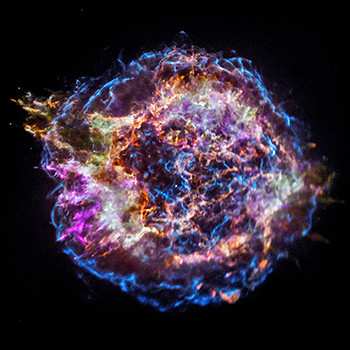
Cassiopeia A
Learn more and listen
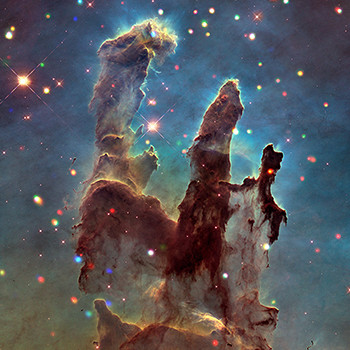
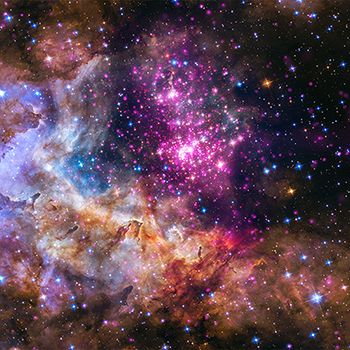
M16/Pillars of Creation
Learn more and listen
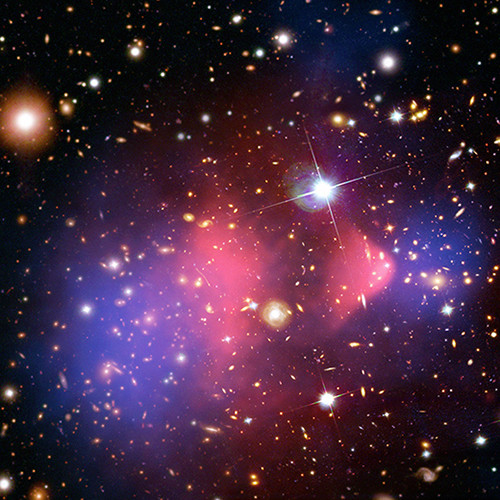
Bullet Cluster
Learn more and listen
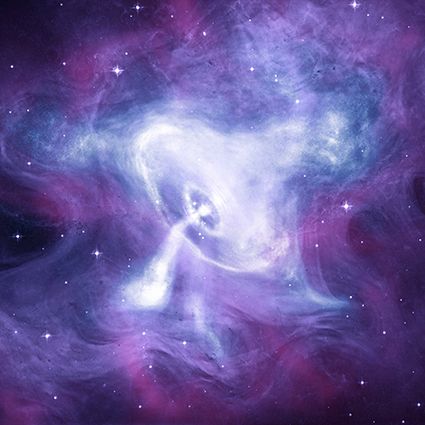
Crab Nebula
Learn more and listen
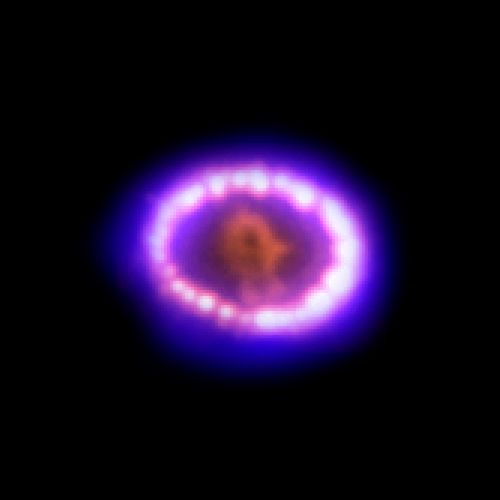
SN87A
Learn more and listen
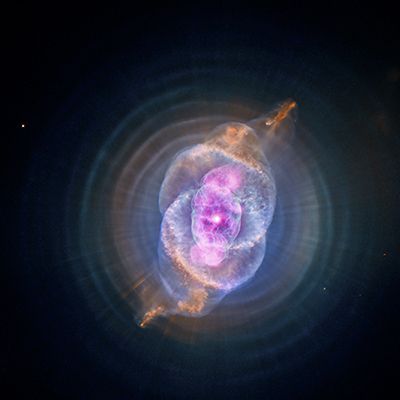
NGC 6543
Learn more and listen
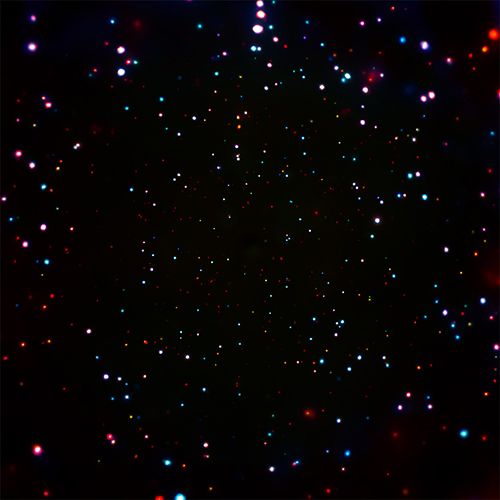
Chandra Deep Field

Learn more and listen
M51
Learn more and listen
WD2
Learn more and listen
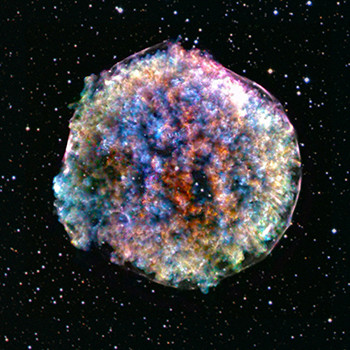
Tycho
Learn more and listen
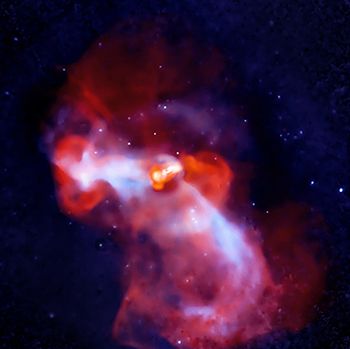
M87
Learn more and listen
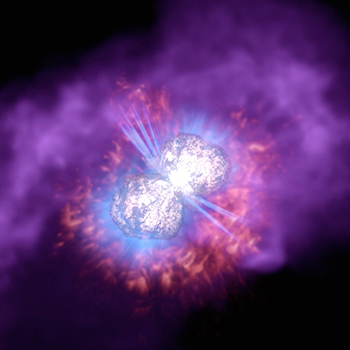
Eta Carinae
Learn more and listen
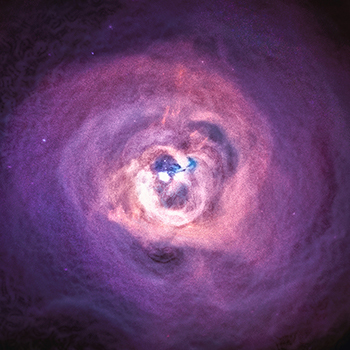
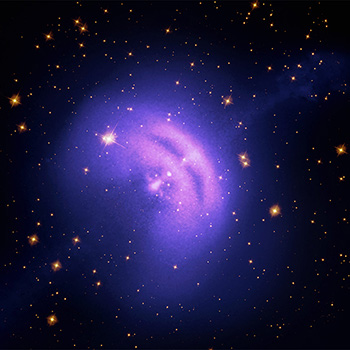
Perseus Cluster
Learn more and listen
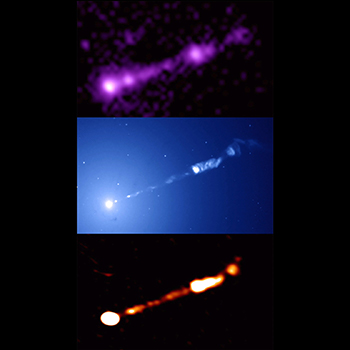
M87 Jet
Learn more and listen
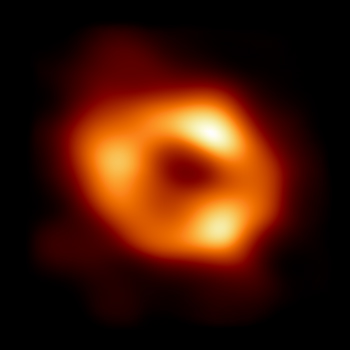
Sagittarius A* (EHT)
Learn more and listen
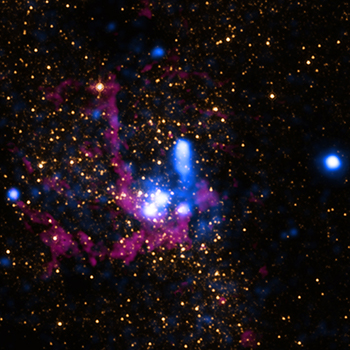
Sagittarius A*

Learn more and listen
Carina Nebula
Learn more and listen
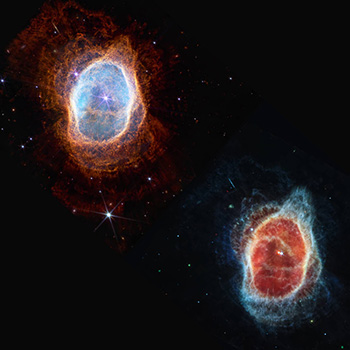
Southern Ring Nebula
Learn more and listen
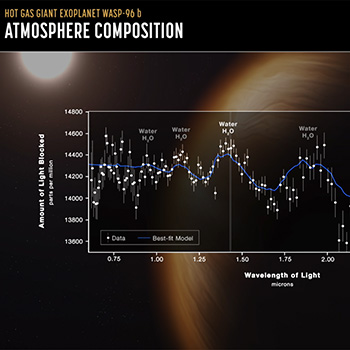
WASP-96 b
Learn more and listen
V404 Cygni
Learn more and listen
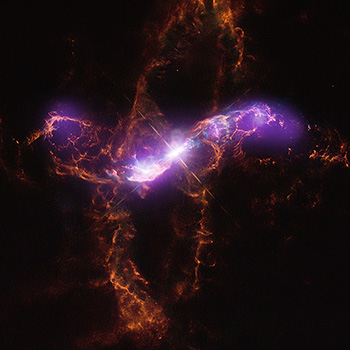
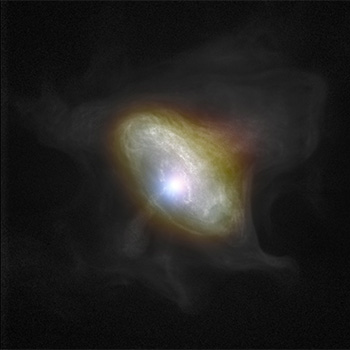
R Aquarii
Learn more and listen
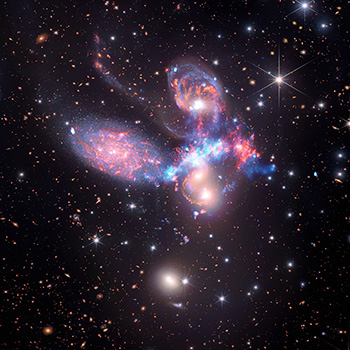
Stephan's Quintet
Learn more and listen
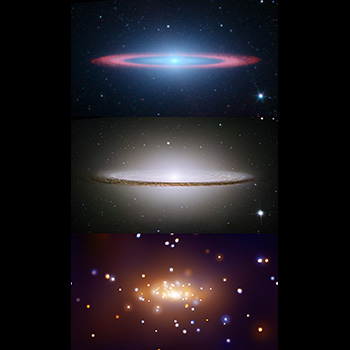
M104
Learn more and listen
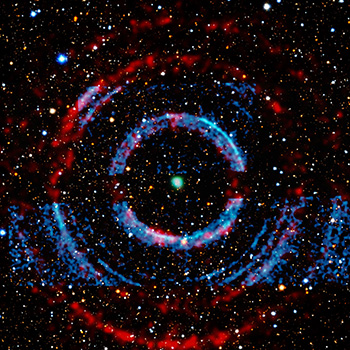
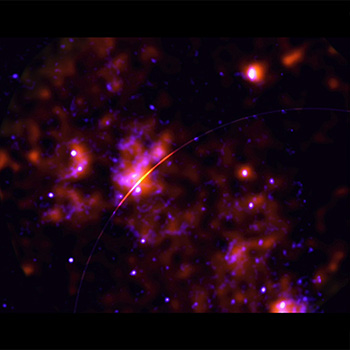
Sagittarius A* Light Echo
Learn more and listen
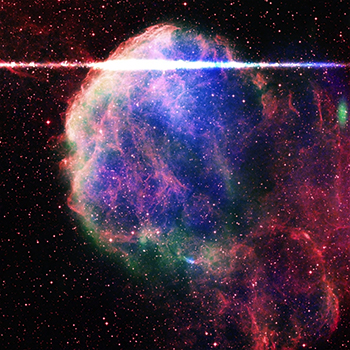
IC 443
Learn more and listen
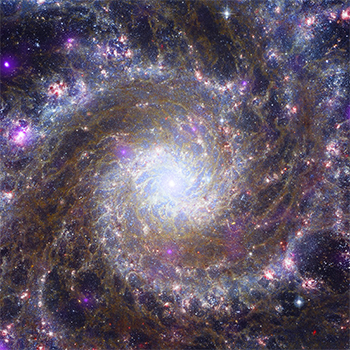
M74
Learn more and listen
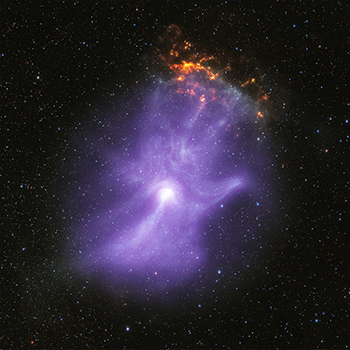
MSH 15-52 / PSR B1509-58
Learn more and listen
Crab Nebula
Learn more and listen
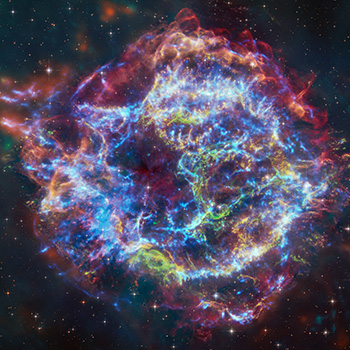
Cassiopeia A Multiwavelength

Learn more and listen
30 Doradus
Learn more and listen
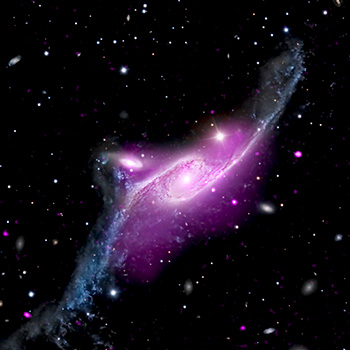
NGC 6872
Learn more and listen
Vela Pulsar
Learn more and listen
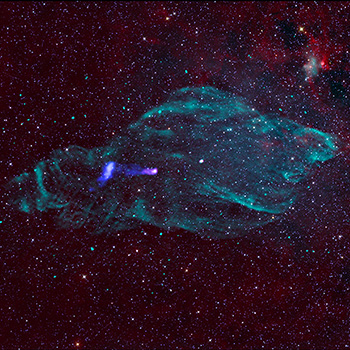
SS 433
Learn more and listen
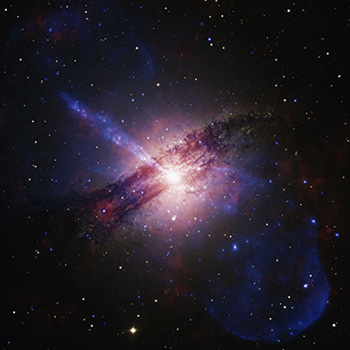
Centaurus A
Learn more and listen
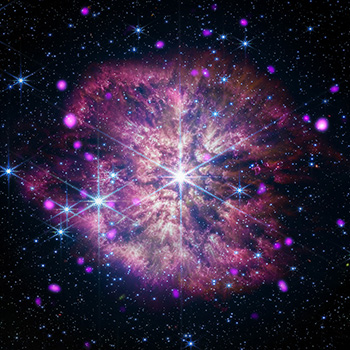
WR 124
Learn more and listen
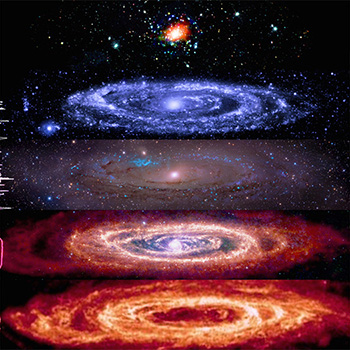
Andromeda (M31)
Learn more and listen
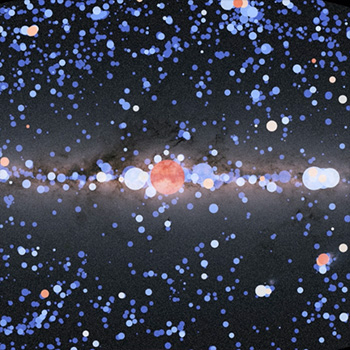
Chandra Source Catalog
Learn more and listen
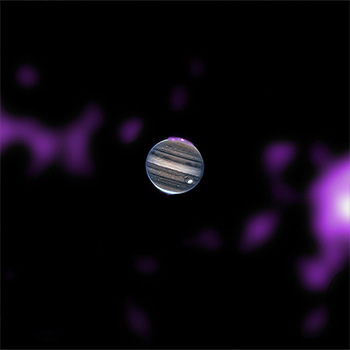
Jupiter
Learn more and listen
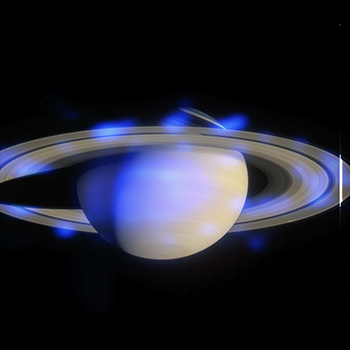
Saturn
Learn more and listen
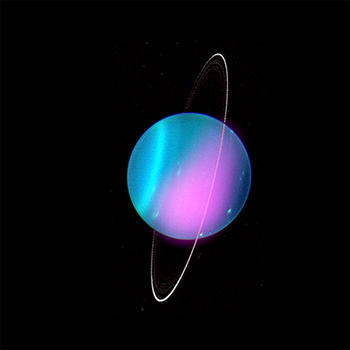
Uranus

Resources


What is this project?
In 2020, experts at the Chandra X-ray Center and System Sounds began the first ongoing, sustained program at NASA to “sonify” (turn into sound) astronomical data. Sonifications, being completely digital, are a valuable tool to work with our community partners.
Who is involved?
The project at the CXC is led by Dr. Kimberly Arcand, Chandra Visualization Scientist, and Dr. Matt Russo (astrophysicist/musician) and Andrew Santaguida (musician/sound engineer) at System Sounds. Consultant Christine Malec, an accessibility expert, podcaster and member of the blind community also joined the project.
How do you make sonifications?
We take actual observational data from telescopes like NASA’s Chandra X-ray Observatory, Hubble Space Telescope or James Webb Space Telescope and translate it into corresponding frequencies that can be heard by the human ear.
Are all of the sonifications the same?
No, each sonification is different in that we use different techniques based on the object and the data available. Read each caption to find out what process was done. Each sonification is created to best portray the scientific data in a way that makes the most sense for the specific data, keeping it accurately represented and telling the story, while also providing a new way of meaning-making through sound.
What have been the results of the project? Has it been successful?
Success can be measured in many ways, however from user testing of the sonifications with different audiences (from students to adults, and particularly blind or low vision participants), the response has been highly positive. Arcand ran a research study on sonifications with blind and sighted users, the results of which demonstrated high learning gains, enjoyment and wanting to know or learn more as well as strong emotional responses to the data.