
1
Neutron Star Illustration
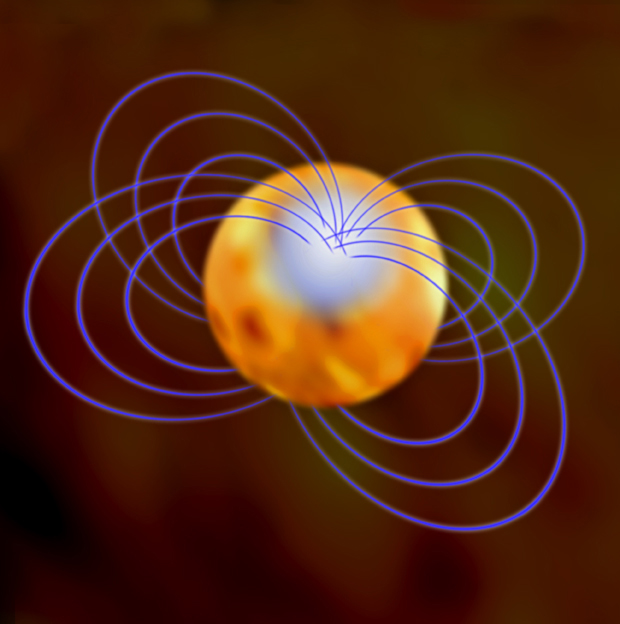
This artist's conception illustrates 1E 1207.4-5209, a neutron star with a polar hot spot and a strong magnetic field (purple lines).
(Credit: CXC/M. Weiss)
This artist's conception illustrates 1E 1207.4-5209, a neutron star with a polar hot spot and a strong magnetic field (purple lines).
(Credit: CXC/M. Weiss)
2
1E1027 Expected v. Observed
Spectra
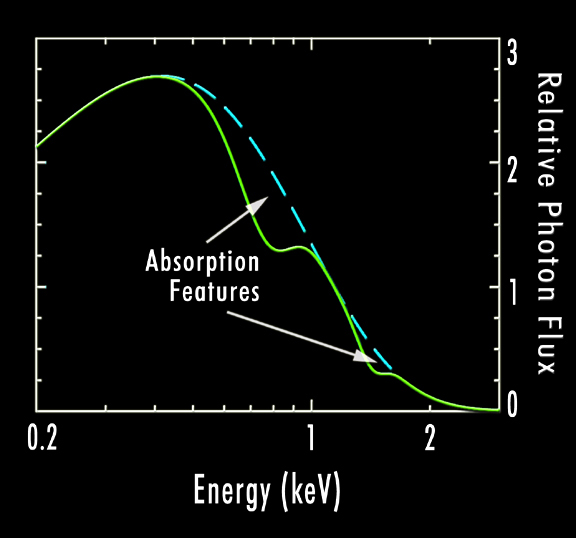
This graph shows the expected (dashed blue line) and the observed (solid green line) spectra of the X-radiation from the polar hot spot on the neutron star. The dips in the observed spectrum are absorption features due to gas in the atmosphere of the neutron star.
(Credit: NASA/PSU/G.Pavlov et al.)
This graph shows the expected (dashed blue line) and the observed (solid green line) spectra of the X-radiation from the polar hot spot on the neutron star. The dips in the observed spectrum are absorption features due to gas in the atmosphere of the neutron star.
(Credit: NASA/PSU/G.Pavlov et al.)
3
1E1027 Expected v. "Best Fit"
Spectra
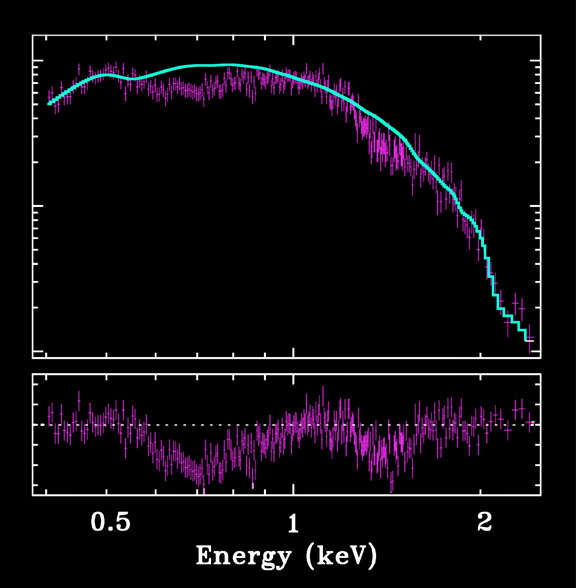
The purple lines in this graph represent the observed data points, along with their statistical error bars (the height of each dash). The solid blue line shows the best fit of a mathematical model calculated to explain the observed data. The bottom panel shows the difference between the observed data and the mathematical model.
(Credit: NASA/PSU/G. Pavlov et al.)
Return to 1E 1207.4-5209 (06 Jun 02)

Revised: July 09, 2008