Introduction and Background:
X-Ray Radiation and Spectroscopy
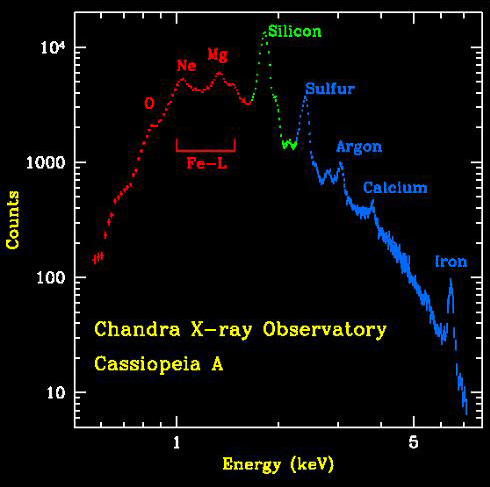
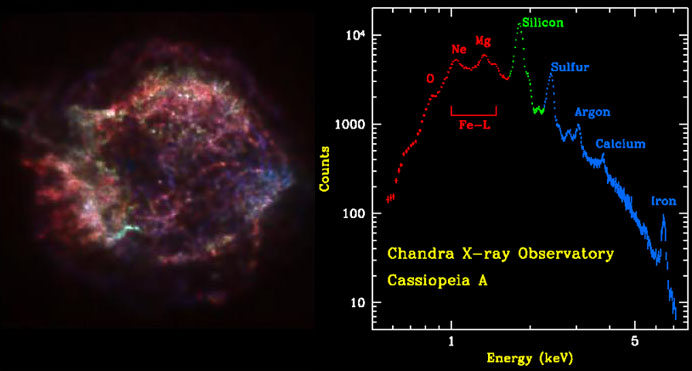
Cas A X-Ray Spectra (Chandra)
The animation above shows the distribution of elements in the Cas A supernova remnant. The X-ray spectrum to the left shows the abundances of those elements. The Cas A spectrum is typical of X-ray spectra, and differs from optical spectra – which is what is we are most familiar with. The cataclysmic spectral image below is an emission spectrum – showing the composition of a star in the optical part of the spectrum. To accurately measure the wavelengths of the emission lines, a spectral plot is constructed. On a spectral plot, the emission lines appear as sharp peaks.
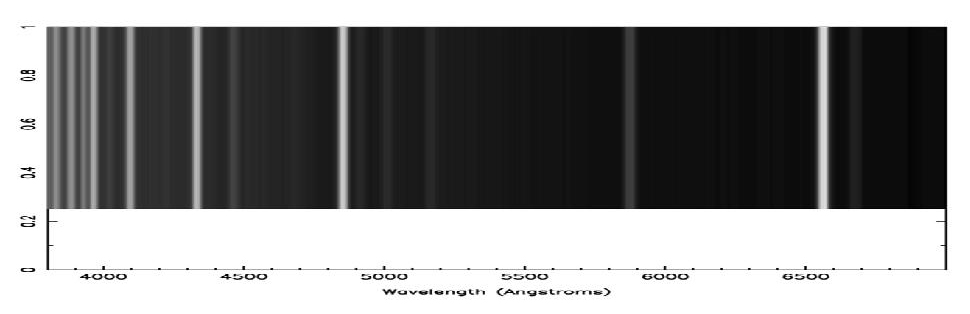
Cataclysmic Spectral Image - Optical
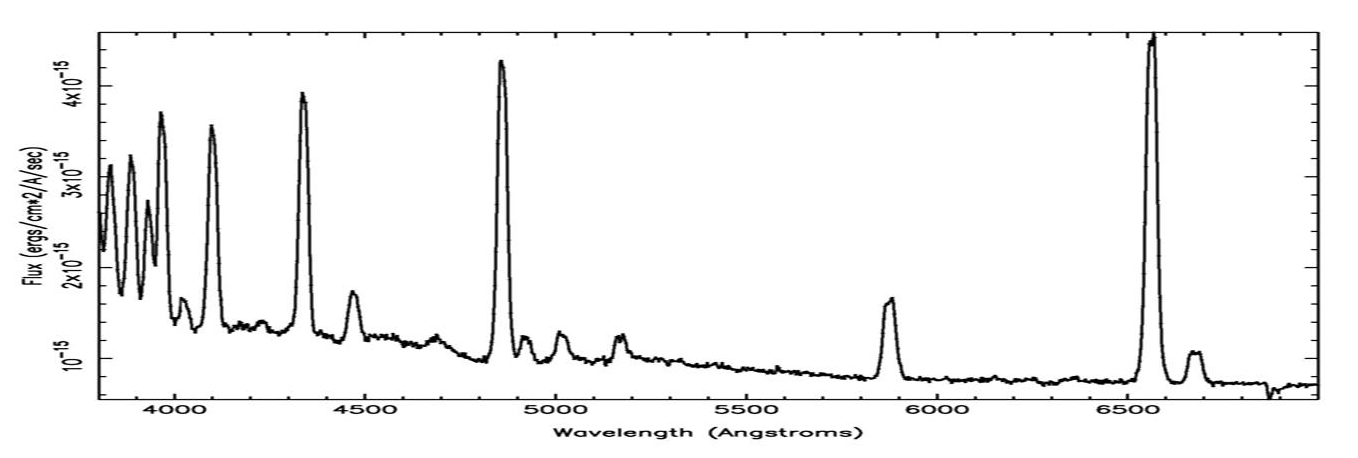
Cataclysmic Spectral Plot - Optical
On the X-ray spectra above, the emission lines produced by the elements also show as peaks; the higher the peak, the stronger the emission line. However on the X-ray spectra the emission lines are superimposed on top of a large curve. This curve is produced by the acceleration of electrons as they are deflected by positively charged atomic nuclei and is called Bremsstrahlung (braking) radiation. Bremsstrahlung is also referred to as free-free radiation. This refers to radiation that arises as a result of a charged particle that is free both before and after the deflection (acceleration) that caused the emission.
When a free-ranging electron is accelerated by the electric field of a proton, the photons emitted can have a wide range of energies that depends on how fast the electrons are moving and how much they are accelerated. The distribution of photon
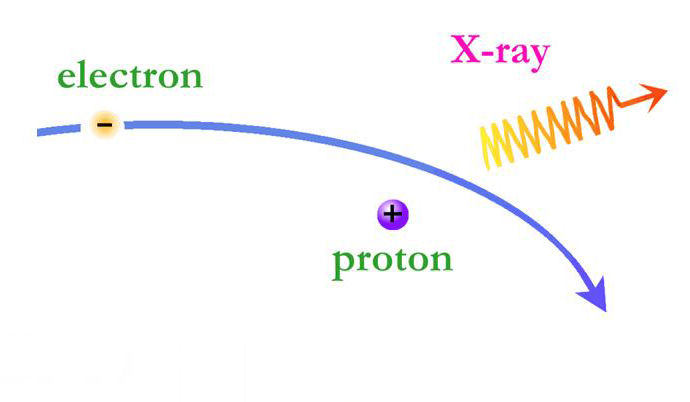
Bremsstrahlung Radiation
energies due to this process is called a continuous spectrum, and is graphed as a smooth curve as in the Cas A spectrum above. In addition, emission lines can appear superimposed on the Bremsstrahlung radiation curve corresponding to the ejection of K and L shell electrons knocked out of atoms in collisions with the high-energy electrons. Higher energy electrons then fall into the vacated energy states emitting X-ray photons and producing the emission lines. The energies of these emission lines can be used to identify the elements in plasmas such as supernova remnants. A hot gas or plasma will produce a spectrum composed of many emission lines due to the various elements that are present.